


Will the S&P 500 Fall Below 5,000 in 2026? A Historically Flawless Predictive Metric Weighs In.
Key Points
The benchmark S&P 500, growth-fueled Nasdaq Composite, and iconic Dow Jones Industrial Average have all rallied by roughly 13% to 22% on a year-to-date basis.
One valuation measure that's been back-tested to January 1871 portends trouble for the S&P 500.
The silver lining for long-term investors is that sell-offs beget opportunity on Wall Street.
- 10 stocks we like better than S&P 500 Index ›
When the curtain closes on 2025 in a little over three weeks, investors will likely be looking back with a smile. As of the closing bell on Dec. 5, the benchmark S&P 500 (SNPINDEX: ^GSPC) had rallied by nearly 17% year-to-date, with the growth-powered Nasdaq Composite (NASDAQINDEX: ^IXIC) and mature stock-driven Dow Jones Industrial Average (DJINDICES: ^DJI) logging respective gains of 22.1% and 12.7%.
Investors have had no shortage of catalysts fueling their optimism this year, including the prospect of future rate cuts by the Federal Reserve, better-than-expected corporate earnings, and multiple game-changing technologies taking shape (e.g., artificial intelligence and quantum computing).
Where to invest $1,000 right now? Our analyst team just revealed what they believe are the 10 best stocks to buy right now. Continue »
But one of the more interesting quirks of investing on Wall Street is that when things seem too good to be true, they often are. Despite the S&P 500 nearing what would be an all-time high of 6,900, one historically flawless predictive metric foresees a challenging road ahead for Wall Street's benchmark index in 2026.

Image source: Getty Images.
This predictive metric hasn't been wrong in 155 years
Before going any further, let's address the elephant in the room. Namely, there isn't a forecasting tool or correlated event that can, with 100% accuracy, guarantee a short-term directional move in any specific stock or broad-based index.
What we do have, as investors, are metrics and events that have strongly, or sometimes even flawlessly, correlated with short-term directional moves for specific stocks or major indexes. It's one of these flawless indicators that should be raising the eyebrows of investors for the new year.
Although Wall Street is constantly contending with potential headwinds, there's perhaps no greater challenge to overcome at the moment than the stock market's valuation.
When investors think about valuing a stock, the price-to-earnings (P/E) ratio probably comes to mind. This time-tested metric is arrived at by dividing a company's share price by its trailing-12-month earnings per share (EPS). Generally, a low P/E ratio is indicative of a stock or index that's undervalued.
Unfortunately, the P/E ratio has inherent flaws. It's not able to account for a company's growth rate, and recessions can easily trip it up. If EPS turns negative, the P/E ratio is no longer useful.
Thus enters the S&P 500's Shiller P/E Ratio, which is also referred to as the cyclically adjusted P/E Ratio, or CAPE Ratio. This valuation tool is based on average inflation-adjusted EPS over the previous 10 years, which means it's still useful, even during short-lived recessions.
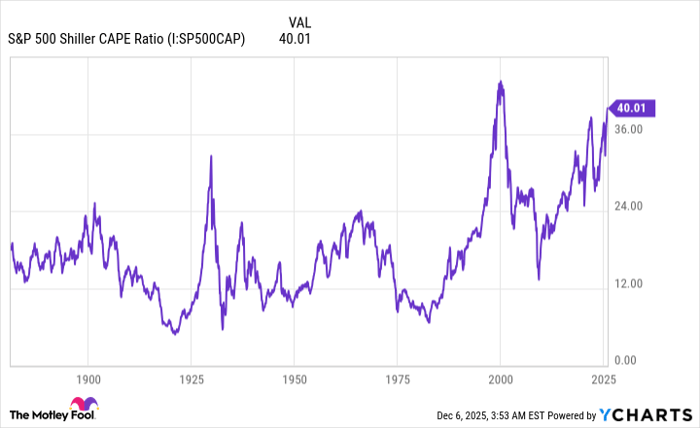
S&P 500 Shiller CAPE Ratio data by YCharts.
When back-tested to January 1871, the S&P 500's Shiller P/E has averaged a multiple of 17.32. However, you'll likely notice that it's spent much of the last 30 years above this 155-year average. With the internet breaking down information barriers that had previously existed between Wall Street and Main Street in the mid-1990s, retail investors have demonstrated a willingness to accept higher valuation premiums.
As of the closing bell on Dec. 5, the Shiller P/E hit a multiple of 40.46, which is a stone's throw away from its high of 41.20 during the current bull market cycle. The only time the stock market has been pricier in 155 years is in the months leading up to the bursting of the dot-com bubble, when the CAPE Ratio peaked at 44.19.
There are two crucial dynamics to consider when evaluating how far above the historical norm stock valuations currently are.
On one hand, Shiller P/E Ratios above 30 have flawlessly foreshadowed eventual double-digit percentage declines in the benchmark index. There have been six instances where the Shiller P/E has topped 30 during a continuous bull market since January 1871, including the present, and the previous five were all followed by 20% or greater declines in the S&P 500, including a 49% peak-to-trough plunge from 2000 to 2002.
The second dynamic is predicting where the bottom will be. While this is far from an exact science, no bear market has ended with a Shiller P/E of higher than 27. If the CAPE Ratio were to retrace to at least 27, it would imply the S&P 500 losing close to a third of its value. In other words, the Shiller P/E Ratio suggests the S&P 500 can fall to 4,600, give or take a little bit in each direction, to satisfy historical precedent.
Keep in mind that the Shiller P/E isn't a timing tool. Although it has a perfect track record of highlighting expected declines of 20% or more in the S&P 500, as well as big drops in the Nasdaq Composite and Dow Jones Industrial Average, it doesn't offer any insight into when the music might stop. Nevertheless, based on what history tells us, there's the real potential for a steep sell-off to or below 5,000 for Wall Street's benchmark index in 2026.

Image source: Getty Images.
Sell-offs beget opportunity for long-term investors
It's understandable if this 2026 forecast isn't what you wanted to hear. Most investors don't enjoy seeing a sea of red arrows in their portfolio, or dealing with elevator-down moves in Wall Street's major stock indexes.
However, significant sell-offs in one or more of Wall Street's major indexes have a way of rolling out the red carpet for opportunistic long-term investors.
In June 2023, shortly after the S&P 500 had gained 20% from its October 2022 bear market low and established itself in a new bull market, the researchers at Bespoke Investment Group published a data set on X (formerly Twitter) that compared the calendar-day length of every S&P 500 bull and bear market dating back to the beginning of the Great Depression (September 1929).
Bespoke found that the average of 27 S&P 500 bear markets spanning almost 94 years resolved in 286 calendar days, or approximately 9.5 months. Only eight out of 27 bear markets endured for at least one year.
It's official. A new bull market is confirmed.
-- Bespoke (@bespokeinvest) June 8, 2023
The S&P 500 is now up 20% from its 10/12/22 closing low. The prior bear market saw the index fall 25.4% over 282 days.
Read more at https://t.co/H4p1RcpfIn. pic.twitter.com/tnRz1wdonp
In comparison, the typical S&P 500 bull market persisted for 1,011 calendar days -- roughly 3.5 times longer than the average bear market.
A separate data set from the analysts at Crestmont Research sheds even more light on the value of time for investors.
Crestmont calculated the rolling 20-year total returns for the S&P 500, including dividends, since the start of the 20th century. Even though the S&P wasn't officially incepted until 1923, researchers were able to calculate the total returns of its components by tracking them in other major indexes back to 1900.
What Crestmont Research was able to show is that all 106 rolling 20-year periods it examined (1900-1919, 1901-1920, and so on, to 2005-2024) generated a positive annualized total return. Put another way, if an investor had hypothetically purchased an S&P 500 tracking index at any point between 1900 and 2005 and simply held it for 20 years, they would have generated a profit every time.
Although history strongly suggests that a significant decline is likely for the S&P 500 in 2026, it also points to substantial long-term upside for stocks.
Should you invest $1,000 in S&P 500 Index right now?
Before you buy stock in S&P 500 Index, consider this:
The Motley Fool Stock Advisor analyst team just identified what they believe are the 10 best stocks for investors to buy now… and S&P 500 Index wasn’t one of them. The 10 stocks that made the cut could produce monster returns in the coming years.
Consider when Netflix made this list on December 17, 2004... if you invested $1,000 at the time of our recommendation, you’d have $540,587!* Or when Nvidia made this list on April 15, 2005... if you invested $1,000 at the time of our recommendation, you’d have $1,118,210!*
Now, it’s worth noting Stock Advisor’s total average return is 991% — a market-crushing outperformance compared to 195% for the S&P 500. Don’t miss out on the latest top 10 list, available when you join Stock Advisor.
See the 10 stocks »
*Stock Advisor returns as of December 8, 2025
Sean Williams has no position in any of the stocks mentioned. The Motley Fool has no position in any of the stocks mentioned. The Motley Fool has a disclosure policy.
Recommended Articles


