
This Is, Officially, the 2nd-Priciest Stock Market in 154 Years -- and There's No Mistaking What Comes Next for Stocks, Based on History
Key Points
The S&P 500, Dow Jones Industrial Average, and Nasdaq Composite have moved into uncharted territory -- and stock valuations are nearly there, as well.
The time-tested Shiller Price-to-Earnings (P/E) Ratio portends trouble to come for Wall Street and investors.
However, the disproportionate nature of stock market cycles overwhelmingly favors optimistic long-term investors.
- 10 stocks we like better than S&P 500 Index ›
Over multidecade periods, history has consistently shown that stocks are the premier wealth creator. While other asset classes, such as real estate and bonds, have generated nominal gains for investors, nothing has come close to matching the average annual return of stocks over long timelines.
Despite some historic volatility in early April following President Donald Trump's introduction of his tariff and trade policy, the widely followed S&P 500 (SNPINDEX: ^GSPC), iconic Dow Jones Industrial Average (DJINDICES: ^DJI), and innovation-fueled Nasdaq Composite (NASDAQINDEX: ^IXIC) have all been off to the races over the last six months and change.
Where to invest $1,000 right now? Our analyst team just revealed what they believe are the 10 best stocks to buy right now. Continue »
Seeing the S&P 500, Dow Jones, and Nasdaq Composite hit multiple record-closing highs in a year is nothing new. But stock valuations are an entirely different story.

Image source: Getty Images.
This is the second-priciest stock market dating back to January 1871
Before going any further, let's state the obvious: there is no blueprint when it comes to valuing individual stocks or the broader market. What you find to be pricey might be viewed as a bargain by another investor. This difference of opinion is what makes the stock market so unpredictable over shorter periods.
When valuing stocks, investors often turn to the time-tested price-to-earnings (P/E) ratio. The P/E ratio is arrived at by dividing a company's share price by its trailing-12-month earnings per share (EPS). While this is a quick-and-easy method for evaluating mature businesses, it has its shortcomings with growth stocks and during recessions when EPS turns decisively lower or negative for public companies.
The valuation measure that offers considerably more utility, when examining the broader market, is the S&P 500's Shiller P/E Ratio. You'll also see this valuation tool referred to as the cyclically adjusted P/E Ratio, or CAPE Ratio.
Whereas the traditional P/E ratio looks back at 12 months of trailing EPS, the Shiller P/E is based on average inflation-adjusted EPS over the prior 10 years. A more encompassing EPS data set ensures that shock events and recessions won't skew the readings.
The CAPE Ratio has been back-tested to January 1871 and has averaged a multiple of 17.29. You'll note on the 154-year chart below that it's spent much of the last 30 years above this historical average, with lower interest rates and the proliferation of the internet encouraging risk-taking and enticing investors to buy faster-growing stocks.
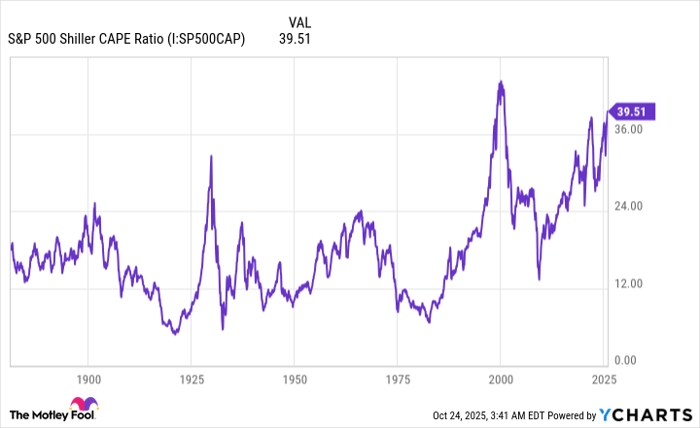
S&P 500 Shiller CAPE Ratio data by YCharts.
Recently, the S&P 500's Shiller P/E hit a peak of 40.33 during the current bull market. This marks the second-highest multiple during a continuous bull market since 1871! There have only been six times, in total, where the Shiller P/E has surpassed and held 30 for at least a two-month period -- and the prior five, eventually, ended in disaster for stocks:
- August to September 1929: Just prior to the Great Depression taking shape, the Shiller P/E surpassed 30 for the first time in its history. The Dow Jones Industrial Average would lose 89% of its value on a peak-to-trough basis during the Great Depression.
- June 1997 to August 2001: In December 1999, mere months before the dot-com bubble burst, the Shiller P/E maxed out at 44.19. During the dot-com meltdown, the S&P 500 and Nasdaq Composite would lose 49% and 78% of their respective value.
- September 2017 to November 2018: The third instance of the Shiller P/E topping 30 was eventually spoiled by a fourth-quarter sell-off in 2018 that saw the benchmark S&P 500 lose 20%.
- December 2019 to February 2020: Just prior to the COVID-19 pandemic, the CAPE Ratio again ascended above 30. The COVID-19 crash in February-March 2020 lopped off 33% of the S&P 500's value in just five weeks.
- August 2020 to May 2022: During the first week of January 2022, the Shiller P/E inched above 40 by a few hundredths before giving way to the 2022 bear market. This roughly nine-month downturn sent the S&P 500 lower by 25%.
- November 2023 to present: The current artificial intelligence (AI)- and quantum computing-fueled rally has seen the Shiller P/E hit a high of 40.33.
History couldn't be any clearer that premium valuations aren't sustainable over an extended period. Although it's impossible to forecast the "when?" or "why?" when it comes to stock market corrections and bear markets, the historical evidence appears overwhelming that stocks are headed for serious downside at some point in the presumed not-too-distant future.

Image source: Getty Images.
Stock market corrections provide an opportunity for long-term investors to shine
Over shorter timelines, history isn't always the friend of investors. Based on the above correlations, the minimum expected decline in the S&P 500 when valuations become extended to the upside is 20%. It's not the most encouraging forecast.
However, historical precedent is an undisputed ally of optimistic long-term investors. This means every stock market correction, bear market, or elevator-down crash throughout history has proved to be a buying opportunity.
Every year, the analysts at Crestmont Research update a data set that calculates the rolling 20-year total returns, including dividends, for the broad-based S&P 500 dating back to 1900. Even though the S&P wasn't officially incepted until 1923, researchers were able to track the total returns of its components in other major indexes dating back to the start of the 20th century.
Crestmont's data set yielded 106 unique rolling 20-year periods: 1900-1919, 1901-1920, and so on, to 2005-2024. All 106 of these 20-year timelines have generated a positive annualized total return.
Put simply, if an investor had, hypothetically (since index funds weren't available on U.S. exchanges until 1993), purchased an S&P 500 tracking fund at any point between 1900 and 2005 and held for 20 years, they would have seen their initial investment, including dividends, grow. Holding through corrections, bear markets, crashes, recessions, depressions, wars, pandemics, and so on, had no effect on this more than century-long streak.
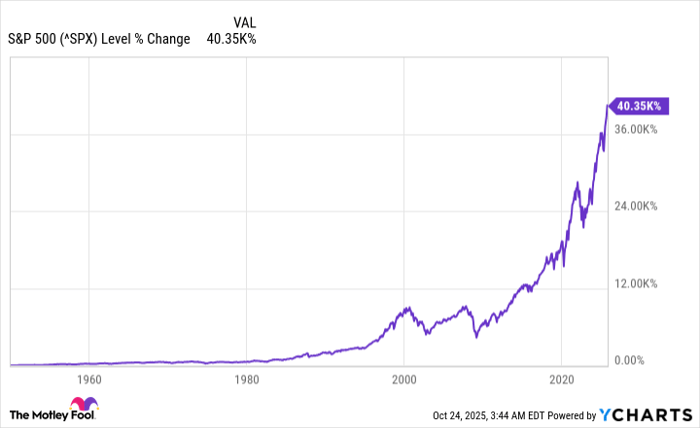
^SPX data by YCharts. The above chart of the S&P 500 only goes back as far as Jan. 3, 1950.
Looking at stock market cycles a bit more granularly provides additional evidence that being a long-term optimist is a smart move.
Two years ago, Bespoke Investment Group published a data set on X (formerly Twitter) that compared the calendar-day length of bull and bear markets for the S&P 500 dating back to the start of the Great Depression (September 1929). This comparison showed a mile-wide gap between investor optimism and pessimism.
Although stock market downturns are known for tugging on investors' emotions, they're generally short-lived. The average of 27 S&P 500 bear markets resolved in 286 calendar days (around 9.5 months), with none lasting longer than 630 calendar days.
In comparison, the typical S&P 500 bull market has endured for 1,011 calendar days. If the current bull market were extrapolated to present day, it would be the 14th S&P 500 bull market out of 27 that has lasted longer than the lengthiest bear market.
Yes, stock valuations portend trouble to come. But history suggests that long-term investors would be wise to pounce on any significant stock market correction.
Should you invest $1,000 in S&P 500 Index right now?
Before you buy stock in S&P 500 Index, consider this:
The Motley Fool Stock Advisor analyst team just identified what they believe are the 10 best stocks for investors to buy now… and S&P 500 Index wasn’t one of them. The 10 stocks that made the cut could produce monster returns in the coming years.
Consider when Netflix made this list on December 17, 2004... if you invested $1,000 at the time of our recommendation, you’d have $590,357!* Or when Nvidia made this list on April 15, 2005... if you invested $1,000 at the time of our recommendation, you’d have $1,141,380!*
Now, it’s worth noting Stock Advisor’s total average return is 1,033% — a market-crushing outperformance compared to 193% for the S&P 500. Don’t miss out on the latest top 10 list, available when you join Stock Advisor.
See the 10 stocks »
*Stock Advisor returns as of October 20, 2025
Sean Williams has no position in any of the stocks mentioned. The Motley Fool has no position in any of the stocks mentioned. The Motley Fool has a disclosure policy.
Recommended Articles


