


EUR/GBP jumps to four-week high as BoE dovish bets offset strong UK data
- EUR/GBP trades at 0.8744, up 0.74%, extending rally to one-month high.
- UK Retail Sales beat expectations, rising 1.5% YoY (vs. 0.4% est.); core up 2.3%.
- Softer inflation earlier in the week keeps BoE rate-cut odds elevated near 65%.
The EUR/GBP advances during the North American session, even though Retail Sales in the UK, exceeded estimates but a softer inflation reading increased the odds for further easing by the Bank of England. The cross trades at 0.8744, up 0.74% as it hits a four-week high.
Sterling weakens despite upbeat sales figures; Euro lifted by firmer PMIs across the bloc
Earlier, the Office for National Statistics (ONS) revealed that Retail Sales in in September rose 1.5% YoY exceeding forecasts of 0.4%, boosted by technology, and demand for Gold from online retailers. Core sales, which exclude petrol, expanded by 2.3% YoY, above forecasts of 0.7%.
Flash PMIs in the UK showed that business activity is improving, revealed S&P Global on Friday.
Meanwhile, the Eurozone HCOB Manufacturing and Services Flash PMI for October improved from 49.8 to 50, and from 51.3 to 52.6, respectively. Both prints exceeded forecasts, an indication that business activity is picking up as demand jumps.
The latest inflation report in the UK increased the chances of a rate cut by the Bank of England towards the end of the year, remaining at 65%, down from 75% chance a day ago.
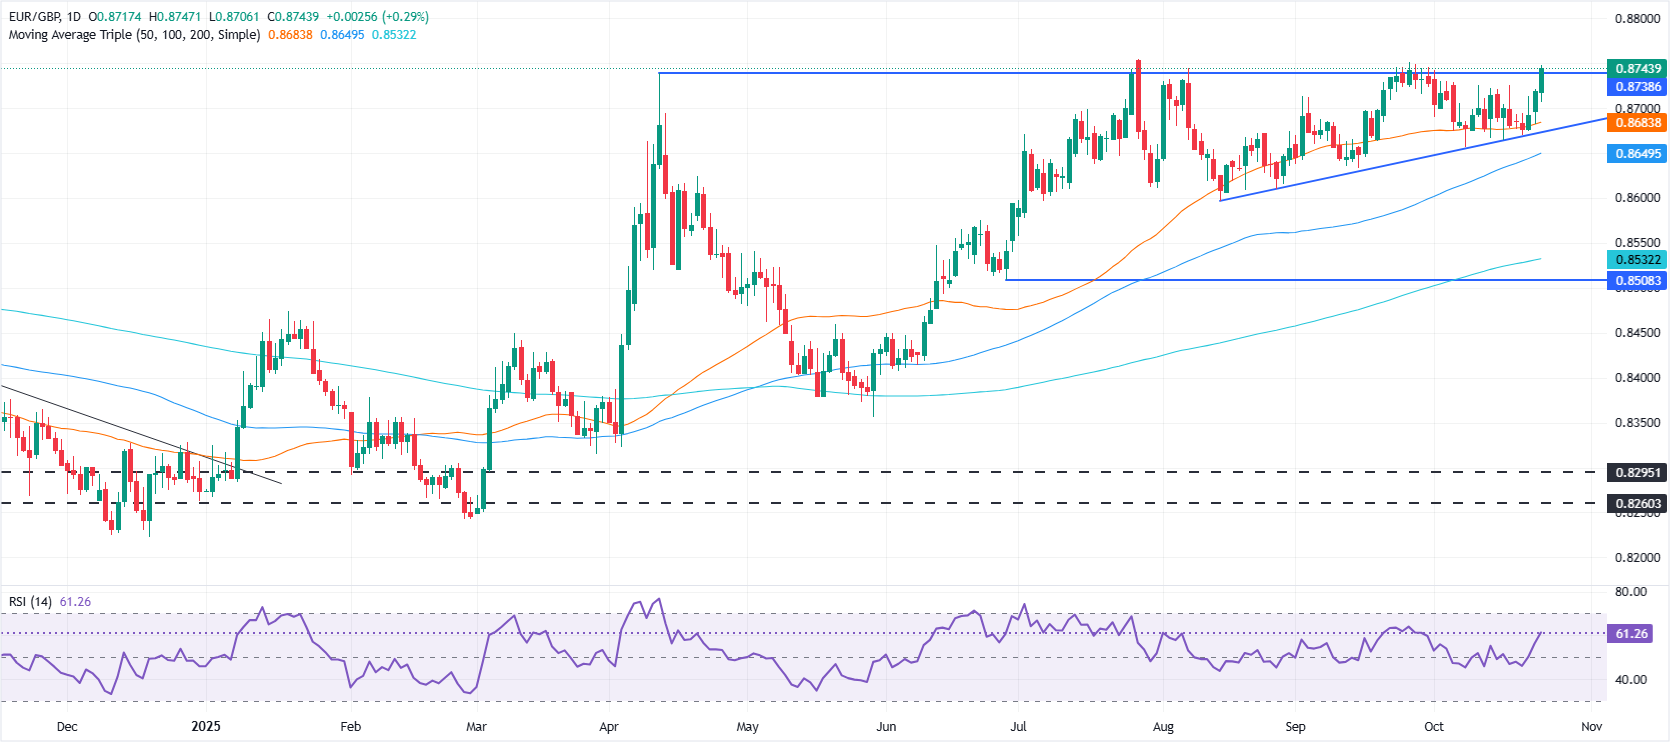
EUR/GBP Price Forecast: Technical outlook
The EUR/GBP shifted neutral to upward biased, but it remains shy of cracking the 2025 high of 0.8757. Although buyers gained momentum, as depicted by the Relative Strength Index (RSI), a breach of the yearly peak could push the cross towards higher prices.
The next key resistance levels seen are 0.88000, followed by the May 3, 2023, daily high at 0.8835.
Euro Price This week
The table below shows the percentage change of Euro (EUR) against listed major currencies this week. Euro was the strongest against the Japanese Yen.
| USD | EUR | GBP | JPY | CAD | AUD | NZD | CHF | |
|---|---|---|---|---|---|---|---|---|
| USD | 0.35% | 1.01% | 1.50% | -0.04% | -0.29% | -0.19% | 0.51% | |
| EUR | -0.35% | 0.67% | 1.23% | -0.38% | -0.54% | -0.60% | 0.17% | |
| GBP | -1.01% | -0.67% | 0.33% | -1.05% | -1.20% | -1.27% | -0.51% | |
| JPY | -1.50% | -1.23% | -0.33% | -1.57% | -1.80% | -1.74% | -1.08% | |
| CAD | 0.04% | 0.38% | 1.05% | 1.57% | -0.21% | -0.22% | 0.54% | |
| AUD | 0.29% | 0.54% | 1.20% | 1.80% | 0.21% | -0.07% | 0.70% | |
| NZD | 0.19% | 0.60% | 1.27% | 1.74% | 0.22% | 0.07% | 0.77% | |
| CHF | -0.51% | -0.17% | 0.51% | 1.08% | -0.54% | -0.70% | -0.77% |
The heat map shows percentage changes of major currencies against each other. The base currency is picked from the left column, while the quote currency is picked from the top row. For example, if you pick the Euro from the left column and move along the horizontal line to the US Dollar, the percentage change displayed in the box will represent EUR (base)/USD (quote).
Recommended Articles


