Breaking: Bitcoin hits new all-time high, with BTC/USD crossing above $109,400

Source Fxstreet
  • Bitcoin hit a new all-time high, with the BTC/USD pair crossing $109,400 on Wednesday, breaking its previous milestone of $109,228 from January 20.
  • The new milestone marks the second time BTC has established a new all-time high in 2025.
  • Bitcoin has now risen more than 47% since establishing a low below $75,000 on April 7.

Bitcoin (BTC) stretched its rally to 3.5% in the past 24 hours, sending the BTC/USD pair to a new all-time high above $109,400 on Wednesday. Although the BTC/USDT pair is yet to reach new heights on crypto exchange Binance.

BTC’s march to the new milestone on Wednesday follows a 47% rise from a low just below $75,000 on April 7, marking the second time it reached a new all-time high in 2025.

The top cryptocurrency faced intense bearish pressure between January and early April after US President Trump began talks of slapping tariffs on several international trading partners.

Just after establishing a high of $109,228 on January 20, Bitcoin crashed more than 30% to under $75,000 before picking up pace in mid-April following signs of the US reaching trading agreements with several nations.

The entire crypto market is showing bullish signs following BTC’s new high, with the positive sentiment also lifting top altcoins Ethereum, XRP and Solana.

Bitcoin soars above its all-time high

Bitcoin broke above its $105,000 resistance level on Sunday, rising above $106,000 before finding support near $105,200 on Monday. At the time of writing on Wednesday, it rallied and broke above its all-time high of $109,228 set on January 20.

If BTC continues its upward trend into uncharted territory, it could extend the rally toward its next major psychological milestone at $120,000.

The Relative Strength Index (RSI) and Stochastic Oscillator are in their overbought regions, indicating strong bullish momentum. However, traders should be cautious as the chances of a pullback are high due to its overbought condition. The 50-day Simple Moving Average (SMA) is on the verge of crossing above its 200-day SMA, signaling a potential golden cross on the daily chart. If the crossover occurs, it would confirm another buy signal.
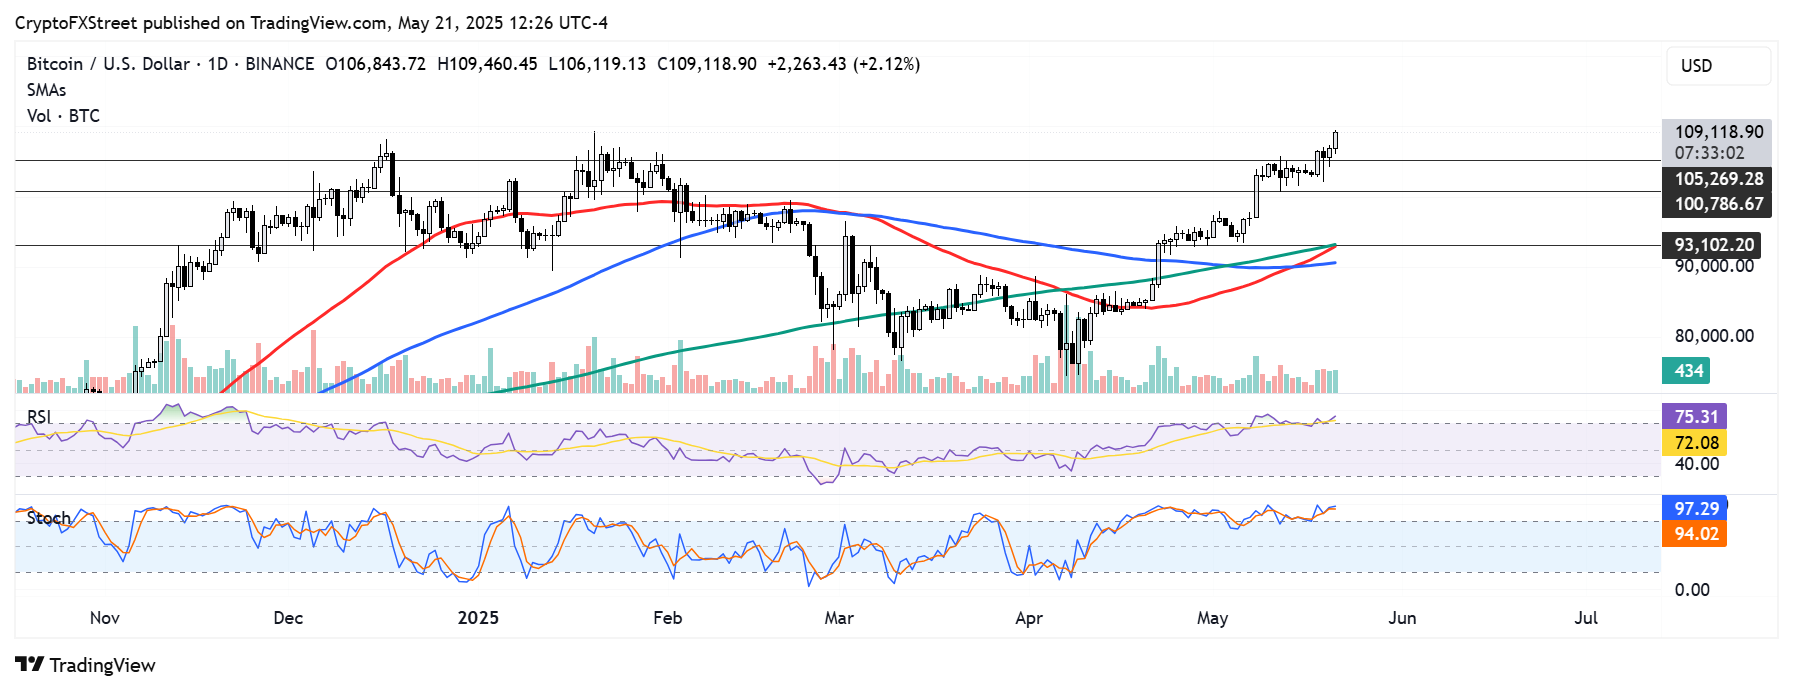
BTC/USD daily chart

However, if BTC faces a pullback and closes below $105,000, it could extend the decline to retest the support near its psychological level at $100,000.

(This is a breaking news and will be updated as the story develops)

Disclaimer: For information purposes only. Past performance is not indicative of future results.
placeholder
Natural Gas sinks to pivotal level as China’s demand slumpsNatural Gas price (XNG/USD) edges lower and sinks to $2.56 on Monday, extending its losing streak for the fifth day in a row. The move comes on the back of China cutting its Liquified Natural Gas (LNG) imports after prices rose above $3.0 in June. It
Author  FXStreet
Jul 01, 2024
Natural Gas price (XNG/USD) edges lower and sinks to $2.56 on Monday, extending its losing streak for the fifth day in a row. The move comes on the back of China cutting its Liquified Natural Gas (LNG) imports after prices rose above $3.0 in June. It
placeholder
Bitcoin Outlook 2025As the Bitcoin market continues to mature, its 2025 outlook appears highly favourable, driven by institutional adoption and regulatory developments.
Author  TradingKey
Jan 23, Thu
As the Bitcoin market continues to mature, its 2025 outlook appears highly favourable, driven by institutional adoption and regulatory developments.
placeholder
Solana Price Forecast: SOL flashes bearish signals, risks double-digit crashSolana (SOL) price shows early signs of a potential breakdown as it trades lower at $165.40 on Monday. SOL is approaching a key support level that could determine its next major move. Technical indicators flash red, and bearish sentiment intensifies, with short positions hitting a monthly high.
Author  FXStreet
May 19, Mon
Solana (SOL) price shows early signs of a potential breakdown as it trades lower at $165.40 on Monday. SOL is approaching a key support level that could determine its next major move. Technical indicators flash red, and bearish sentiment intensifies, with short positions hitting a monthly high.
placeholder
Ethereum Price Faces Pressure: Can It Sustain Its Recent Rally?Ethereum price found support at $2,460 and started a fresh increase. ETH is now struggling and might drop again below the $2,500 support.
Author  NewsBTC
May 27, Tue
Ethereum price found support at $2,460 and started a fresh increase. ETH is now struggling and might drop again below the $2,500 support.
placeholder
Avalanche Price Forecast: AVAX set to extend losses as Open Interest drops to one-month lowAvalanche (AVAX) trades in the green by almost 1% at press time on Wednesday, as it tests a crucial support floor that has held for over two months.
Author  FXStreet
20 hours ago
Avalanche (AVAX) trades in the green by almost 1% at press time on Wednesday, as it tests a crucial support floor that has held for over two months.
Related Instrument
goTop
quote