AUD/NZD experiences a slight decline as markets await key data

Source Fxstreet
  • AUD/NZD dips mildly to 1.0821 during Monday's session.
  • Markets are eyeing Australia's April CPI and Retail Sales updates this week.
  • Investors will eye New Zealand's May ANZ business survey, which is expected to reveal a slowdown in activity.

The AUD/NZD is presently trading with mild fluctuations, expecting key figures from Australia and New Zealand along the week.

On the Australian side, the focus is primarily on the April Consumer Price Index (CPI) and Retail sales data. The CPI is projected to register a slight decrease, dropping to 3.4% YoY while Retail Sales are expected to recover somewhat. The outcome of the data might shape the expectations of the Reserve Bank of Australia (RBA) which has lately advocated for a cautious stance.

On the other hand, the attention in New Zealand is directed towards the ANZ business survey data for May on Tuesday. The outcome might also shape the bets on the next Reserve Bank of New Zealand (RBNZ)'s monetary policy decisions. While the bank suggested a potential rate hike, market prediction indicates an opposing view, leaning towards a first rate cut in November.

AUD/NZD technical analysis

In the daily chart, the Relative Strength Index (RSI) sits within negative territory. Despite an uptick in the latest reading to 30, the pair remains pressured, as the positive momentum observed earlier in the week has considerably waned. The negative trend, as suggested by the RSI, is further confirmed by the rising red bars of the Moving Average Convergence Divergence (MACD) histogram, affirming the downside momentum.

AUD/NZD daily chart

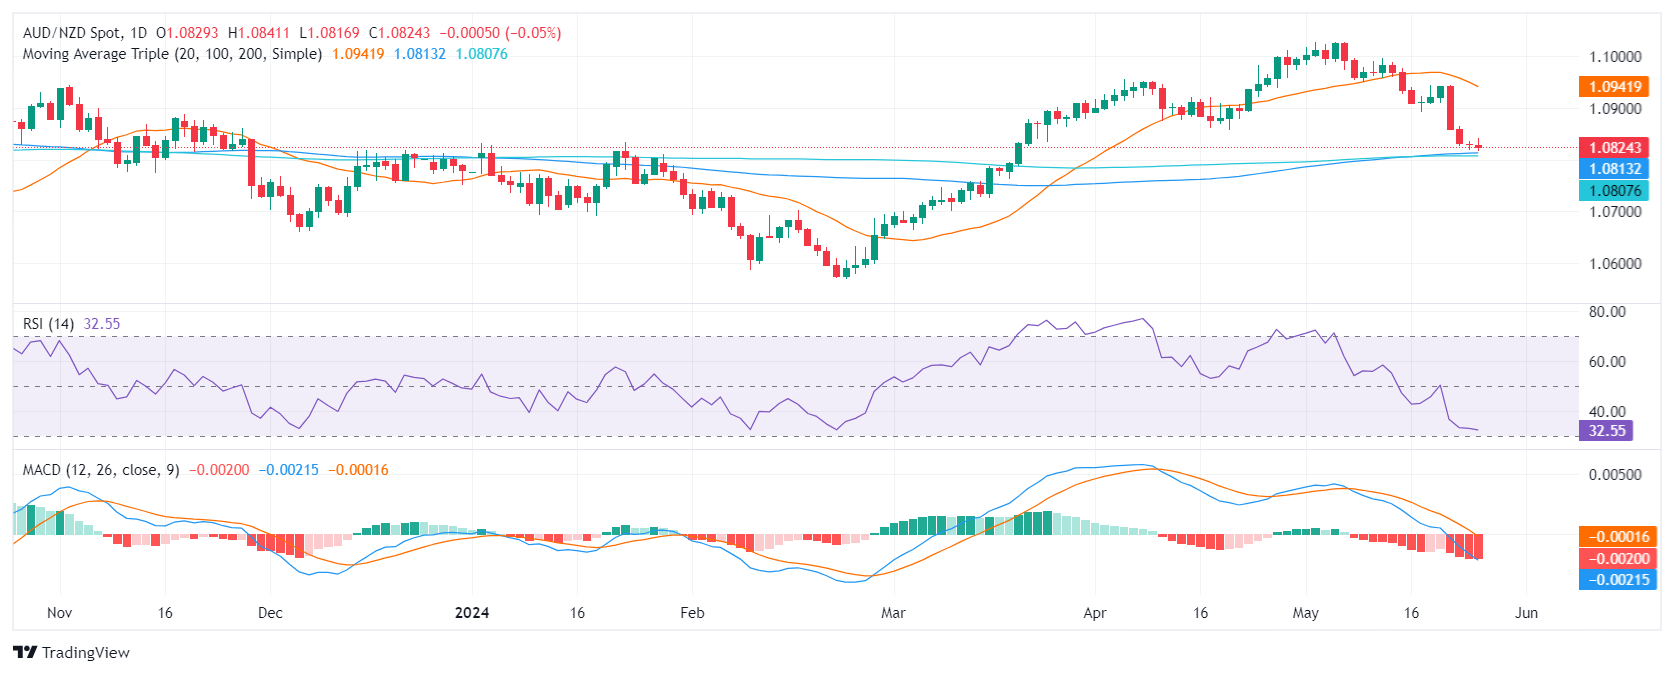
On a positive note, the pair currently trades above its 100 and 200-day Simple Moving Averages (SMA), indicating potential medium-to-long-term upward momentum. However, the AUD/NZD's positioning below the 20-day SMA highlights the near-term volatility anticipated.

AUD/NZD

Overview
Today last price 1.0824
Today Daily Change -0.0005
Today Daily Change % -0.05
Today daily open 1.0829
 
Trends
Daily SMA20 1.095
Daily SMA50 1.092
Daily SMA100 1.0813
Daily SMA200 1.0808
 
Levels
Previous Daily High 1.0837
Previous Daily Low 1.0819
Previous Weekly High 1.0944
Previous Weekly Low 1.0819
Previous Monthly High 1.1012
Previous Monthly Low 1.0857
Daily Fibonacci 38.2% 1.0826
Daily Fibonacci 61.8% 1.083
Daily Pivot Point S1 1.082
Daily Pivot Point S2 1.0811
Daily Pivot Point S3 1.0802
Daily Pivot Point R1 1.0838
Daily Pivot Point R2 1.0846
Daily Pivot Point R3 1.0856


Disclaimer: For information purposes only. Past performance is not indicative of future results.
placeholder
Ethereum (ETH) Price Closes Above $3,900 — Is a New All-Time High Possible Before 2024 Ends?Once again, the price of Ethereum (ETH) has risen above $3,900. This bounce has hinted at a further price increase for the altcoin before the end of the year.
Author  Beincrypto
Dec 17, 2024
Once again, the price of Ethereum (ETH) has risen above $3,900. This bounce has hinted at a further price increase for the altcoin before the end of the year.
placeholder
ECB Policy Outlook for 2026: What It Could Mean for the Euro’s Next MoveWith the ECB likely holding rates steady at 2.15% and the Fed potentially extending cuts into 2026, EUR/USD may test 1.20 if Eurozone growth proves resilient, but weaker growth and an ECB pivot could pull the pair back toward 1.13 and potentially 1.10.
Author  Mitrade
Dec 26, 2025
With the ECB likely holding rates steady at 2.15% and the Fed potentially extending cuts into 2026, EUR/USD may test 1.20 if Eurozone growth proves resilient, but weaker growth and an ECB pivot could pull the pair back toward 1.13 and potentially 1.10.
placeholder
WTI climbs to $76.00, eyes one-year high amid rising tensions in the Middle EastWest Texas Intermediate (WTI) US Crude Oil prices attract fresh buyers on Wednesday and climb back closer to the highest level since January 2025, touched the previous day.
Author  FXStreet
Mar 04, Wed
West Texas Intermediate (WTI) US Crude Oil prices attract fresh buyers on Wednesday and climb back closer to the highest level since January 2025, touched the previous day.
placeholder
Gold rises as safe-haven demand increases on Iran warGold price (XAU/USD) extends its gains for the second successive session on Thursday as traders seek safety amid the ongoing war in the Middle East.
Author  FXStreet
Mar 05, Thu
Gold price (XAU/USD) extends its gains for the second successive session on Thursday as traders seek safety amid the ongoing war in the Middle East.
placeholder
Gold slumps to near $5,050 on oil-driven inflation fears, stronger US DollarGold price (XAU/USD) falls to around $5,065 during the early Asian session on Monday, pressured by a stronger US Dollar (USD) and inflationary risks. Traders will closely monitor the developments surrounding the US-Iran conflicts and geopolitical risks in the Middle East.
Author  FXStreet
12 hours ago
Gold price (XAU/USD) falls to around $5,065 during the early Asian session on Monday, pressured by a stronger US Dollar (USD) and inflationary risks. Traders will closely monitor the developments surrounding the US-Iran conflicts and geopolitical risks in the Middle East.
Related Instrument
goTop
quote