USD/THB advances as US economy signals strength

Source Fxstreet
  • The USD/THB bulls gain momentum, with the pair showing a 0.56% spike.
  • Favorable PMI data and stable unemployment figures, coupled with the Federal Reserve's unwavering stance favor the USD.
  • Markets are giving up their hopes of a cut in September by the Fed.

The USD/THB pair is gaining strength rising to 36.60 on Thursday due to the Federal Reserve's (Fed) persistent hawkish stance on maintaining high interest rates. This is backed by better-than-expected Manufacturing PMI data and low unemployment claims in the US, providing a favorable economic environment.

The latest US data showed a robust PMI reading for May, exceeding expectations with manufacturing PMI at 50.9, up from April's 50.0, and outpacing the forecast of 50.0. The Services PMI also saw an impressive surge, reaching 54.8 from April’s figure of 51.3, significantly beating a 51.3 forecast.

In addition, the US Labor Department declared a smaller-than-anticipated rise in unemployment benefits, which marked another positive note for the US economy. All these factors, combined with the Federal Reserve's steadfast commitment to high interest rates, benefited the Greenback against its peers on Thursday. In that sense, according to the CME FedWatch tool, markets have practically given up the hopes of a cut by the Fed until September. In that month’s meeting, investors now see just a 40% chance of the easing cycle starting.

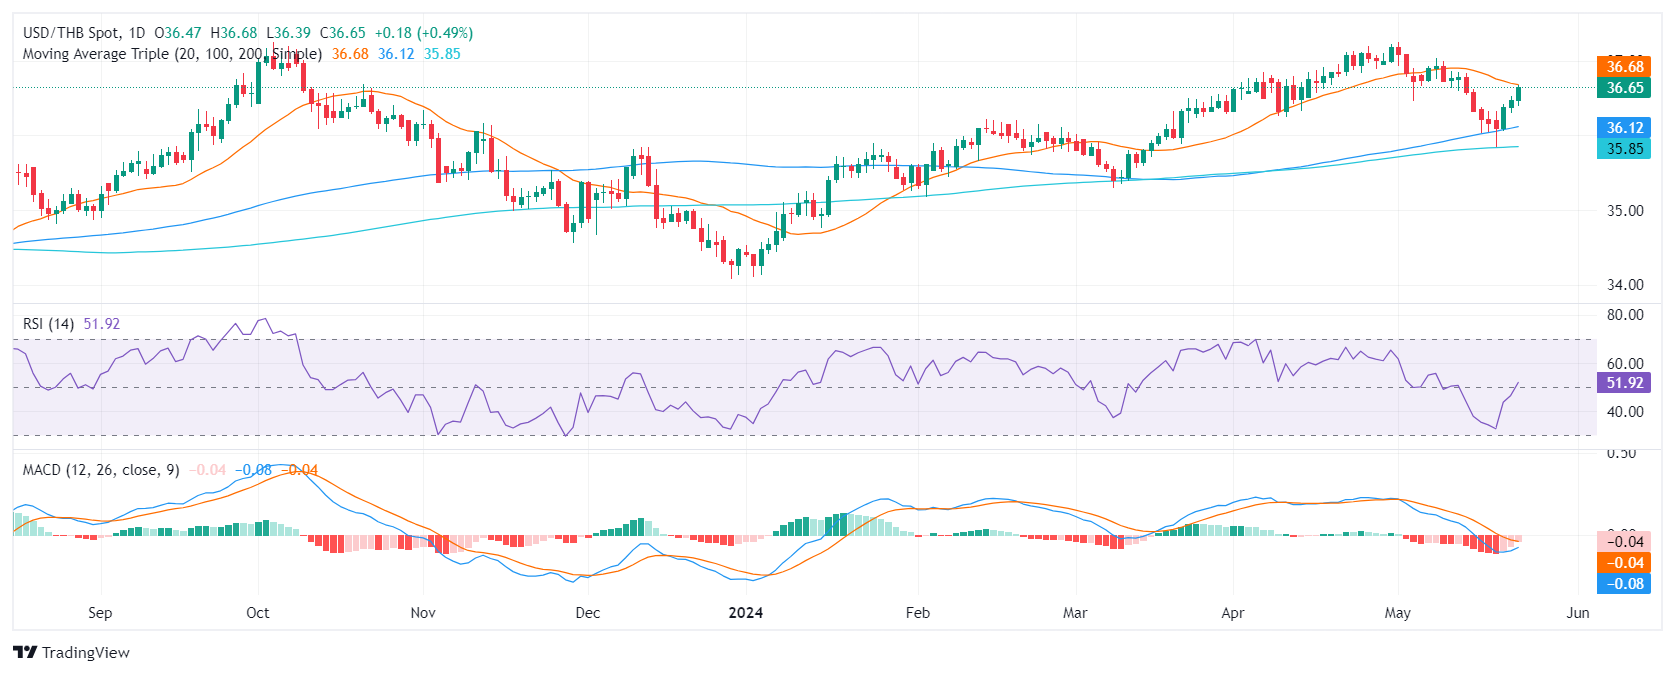
USD/THB technical analysis

Within the daily view, the Relative Strength Index (RSI) shows a transition from negative to positive territory. The market dynamics quickly flipped from an oversold to a positive trend with the latest RSI reading standing above the mid-line. The buyers appear to have gained control, offsetting prior losses and establishing a more optimistic outlook.

Supporting this is the trend witnessed in the Moving Average Convergence Divergence (MACD) histogram, which displays declining red bars. This indicates a diminishing negative momentum, aligning with the bullish context presented by the RSI above.

USD/THB daily chart

Disclaimer: For information purposes only. Past performance is not indicative of future results.
placeholder
Bulls Rout. Bitcoin Slumps Over 16% in a Week to Hit Bottom, Cryptocurrency Market Faces "Serial Liquidations"During the Asian trading session on June 5, Bitcoin extended its recent slump, falling more than 3.5% within 24 hours. It briefly broke below $62,000, hitting a low of $61,100, bringing i
Author  TradingKey
9 hours ago
During the Asian trading session on June 5, Bitcoin extended its recent slump, falling more than 3.5% within 24 hours. It briefly broke below $62,000, hitting a low of $61,100, bringing i
placeholder
Gold declines below $4,500 on stalled US-Iran ceasefire talks, US NFP data loomsGold price (XAU/USD) edges lower to near $4,470 during the early Asian session on Friday. The precious metal remains volatile amid ongoing geopolitical turmoil. Traders will closely monitor the developments surrounding the US-Iran peace deal and the US May employment report later on Friday. 
Author  FXStreet
17 hours ago
Gold price (XAU/USD) edges lower to near $4,470 during the early Asian session on Friday. The precious metal remains volatile amid ongoing geopolitical turmoil. Traders will closely monitor the developments surrounding the US-Iran peace deal and the US May employment report later on Friday. 
placeholder
Bitcoin Suffers Year’s Strongest Waterfall-Style Decline. Will It Next Drop to the $60,000 Mark?During the Asian trading session on June 4, Bitcoin continued its multi-day slump, briefly dropping below the $62,000 mark to $61,338. As of press time, Bitcoin was trading at $63,844, wi
Author  TradingKey
Yesterday 10: 07
During the Asian trading session on June 4, Bitcoin continued its multi-day slump, briefly dropping below the $62,000 mark to $61,338. As of press time, Bitcoin was trading at $63,844, wi
placeholder
Bitcoin drops below $65K amid reinforced bear market signalsBitcoin (BTC) dipped further below $65,000 on Wednesday, with onchain data from Glassnode signaling a market firmly in a bear phase. The decline has pushed prices back into a key valuation range between the Realized Price and the True Market Mean.
Author  FXStreet
Yesterday 01: 32
Bitcoin (BTC) dipped further below $65,000 on Wednesday, with onchain data from Glassnode signaling a market firmly in a bear phase. The decline has pushed prices back into a key valuation range between the Realized Price and the True Market Mean.
placeholder
Forex Today: US Dollar stays resilient ahead of key US dataHere is what you need to know on Wednesday, June 3:
Author  FXStreet
Jun 03, Wed
Here is what you need to know on Wednesday, June 3:
goTop
quote