

US GDP set to accelerate in Q1, suggesting economic resilience despite Iran war woes
- The United States Gross Domestic Product is seen expanding at an annualised rate of 2.3% in Q1.
- Investors will focus on the potential impact of the US-Iran conflict on the economy.
- The US Dollar remains in recovery mode following April lows.
The United States (US) Bureau of Economic Analysis (BEA) is set to publish its preliminary estimate of first-quarter Gross Domestic Product (GDP) on Thursday, with analysts expecting the data to show annualised growth at a solid 2.3%, a sharp rebound from the meagre 0.5% expansion recorded in the final quarter of 2024.
Markets brace for US growth data amid geopolitical woes…and a new Fed?
Investors are anxious ahead of Thursday's release of the US preliminary GDP figures for the January-March period, which is generally seen as the most market-moving estimate of the three issued each quarter. Beyond headline growth, the report also includes fresh Personal Consumption Expenditures (PCE) data, the Federal Reserve’s (Fed) preferred inflation gauge.
This quarter’s numbers are especially important, as market participants will look for early signs, if any at all, of the ongoing crisis in the Middle East, as well as delayed effects from Trump’s tariffs, all with the broader White House administration policies at the centre of the debate.
The release follows the Fed’s April 28-29 meeting, where the Committee delivered a widely anticipated “on hold” decision on the Fed Funds Target Range (FFTR).
Also included in the report is the GDP Price Index, commonly called the GDP deflator, which measures inflation across all domestically produced goods and services, including exports but excluding imports. These data will become more prominent amid the ongoing US-Iran conflict and its clear impact on crude Oil prices.
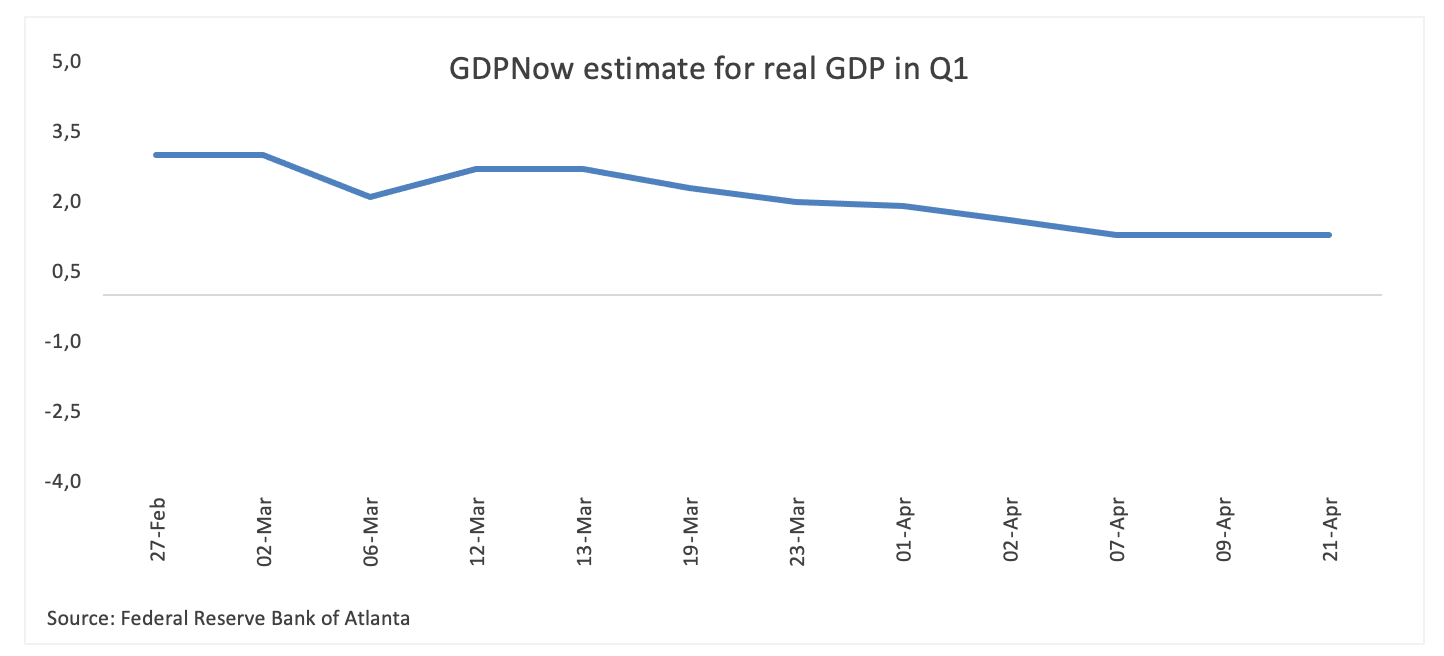
The Atlanta Fed’s GDPNow model, closely watched for its real-time tracking of economic activity, forecast a 1.2% expansion in Q1 GDP as of its April 21 update (from 1.3% set on April 9).
When will the GDP print be released, and how can it affect the US Dollar Index?
The US GDP report, due at 12:30 GMT on Thursday, could prove pivotal for the US Dollar (USD) in case of a big surprise in either direction, as markets remain almost exclusively focused on developments from the Middle East. Alongside the headline growth figure, markets will scrutinise updates to the GDP Price Index and the Q1 Personal Consumption Expenditures (PCE) Price Index, key data points that could shift expectations for Federal Reserve policy and the Greenback’s direction.
A stronger-than-expected GDP print may temporarily ease fears of a stagflationary environment, potentially offering a tailwind for the current recovery of the buck.
The broader technical outlook for the US Dollar Index (DXY) remains slightly constructive amid the ongoing consolidative price action. The index is trading near its 200-day SMA at 98.53 and below its 200-week SMA at 103.13.
Downside levels remain in focus, with support eyed at 97.63 – April’s low. Any upside correction could first target the 2026 ceiling at 100.63 seen in late March, seconded by the March 2025 high of 104.68.
Momentum indicators lean bearish, with the Relative Strength Index (RSI) on the daily chart near 47 and the Average Directional Index (ADX) just below 23, suggesting fading strength behind the recent upward move.
US Dollar FAQs
The US Dollar (USD) is the official currency of the United States of America, and the ‘de facto’ currency of a significant number of other countries where it is found in circulation alongside local notes. It is the most heavily traded currency in the world, accounting for over 88% of all global foreign exchange turnover, or an average of $6.6 trillion in transactions per day, according to data from 2022. Following the second world war, the USD took over from the British Pound as the world’s reserve currency. For most of its history, the US Dollar was backed by Gold, until the Bretton Woods Agreement in 1971 when the Gold Standard went away.
The most important single factor impacting on the value of the US Dollar is monetary policy, which is shaped by the Federal Reserve (Fed). The Fed has two mandates: to achieve price stability (control inflation) and foster full employment. Its primary tool to achieve these two goals is by adjusting interest rates. When prices are rising too quickly and inflation is above the Fed’s 2% target, the Fed will raise rates, which helps the USD value. When inflation falls below 2% or the Unemployment Rate is too high, the Fed may lower interest rates, which weighs on the Greenback.
In extreme situations, the Federal Reserve can also print more Dollars and enact quantitative easing (QE). QE is the process by which the Fed substantially increases the flow of credit in a stuck financial system. It is a non-standard policy measure used when credit has dried up because banks will not lend to each other (out of the fear of counterparty default). It is a last resort when simply lowering interest rates is unlikely to achieve the necessary result. It was the Fed’s weapon of choice to combat the credit crunch that occurred during the Great Financial Crisis in 2008. It involves the Fed printing more Dollars and using them to buy US government bonds predominantly from financial institutions. QE usually leads to a weaker US Dollar.
Quantitative tightening (QT) is the reverse process whereby the Federal Reserve stops buying bonds from financial institutions and does not reinvest the principal from the bonds it holds maturing in new purchases. It is usually positive for the US Dollar.
Economic Indicator
Gross Domestic Product Annualized
The real Gross Domestic Product (GDP) Annualized, released quarterly by the US Bureau of Economic Analysis, measures the value of the final goods and services produced in the United States in a given period of time. Changes in GDP are the most popular indicator of the nation’s overall economic health. The data is expressed at an annualized rate, which means that the rate has been adjusted to reflect the amount GDP would have changed over a year’s time, had it continued to grow at that specific rate. Generally speaking, a high reading is seen as bullish for the US Dollar (USD), while a low reading is seen as bearish.
Read more.Last release: Thu Apr 09, 2026 12:30
Frequency: Quarterly
Actual: 0.5%
Consensus: 0.7%
Previous: 0.7%
Source: US Bureau of Economic Analysis
The US Bureau of Economic Analysis (BEA) releases the Gross Domestic Product (GDP) growth on an annualized basis for each quarter. After publishing the first estimate, the BEA revises the data two more times, with the third release representing the final reading. Usually, the first estimate is the main market mover and a positive surprise is seen as a USD-positive development while a disappointing print is likely to weigh on the greenback. Market participants usually dismiss the second and third releases as they are generally not significant enough to meaningfully alter the growth picture.
Recommended Articles


