


GBP/USD slips below 1.33 as US and UK manufacturing activity slumps
- GBP/USD pressured as risk sentiment wavers and Fed seen cutting later than BoE.
- UK manufacturing contracts for seventh month; traders price in 100 bps BoE easing.
- US ISM PMI weak, but tariff-driven price growth boosts Dollar on risk of stagflation.
The Pound Sterling edges lower against the US Dollar on Thursday, with most European markets closed during Labor Day. The release of manufacturing activity data on both sides of the Atlantic and US trade policies continued to drive the financial markets. At the time of writing, the GBP/USD trades at 1.3295, down 0.25%.
GBP/USD down 0.25% to 1.3295 as weak UK PMI and rising US jobless claims fuel policy divergence bets
The US cash equity markets opened the session in the green. Recently released data by the ISM showed that manufacturing activity in the US deteriorated in April. The ISM Manufacturing PMI missed estimates of 48 and increased by 48.7, down from the March 49 reading.
Comments from Timothy Fiore, the ISM Manufacturing Business Survey Committee Chair, revealed that demand and production retreated while layoffs continued. He added, “Price growth accelerated slightly due to tariffs, causing new order placement backlogs, supplier delivery slowdowns, and manufacturing inventory growth.”
The survey by S&P Global announced that “Manufacturing continued to flat-line in April amid worrying downside risks to the outlook and sharply rising costs,” said Chris Williamson, Chief Business Economist at S&P Global. The S&P Global Manufacturing PMI was up at 50.2 in April, unchanged since March, but remained at expansionary territory.
Earlier, Initial Jobless Claims for the previous week rose to its highest level since February. Claims for the week ending April 26 rose by 241K, much higher than the 224K expected and up from 223K revealed a week ago.
The data boosted the Greenback as depicted by the GBP/USD price action, extending its fall below 1.3300 for the second time in the week.
Meanwhile, S&P Global revealed that the UK’s manufacturing activity contracted for the seventh straight month in April. Consequently, traders had priced in 100 basis points (bps) of easing by the Bank of England (BoE), which is set to lower rates at the May 8 meeting.
The Fed is also projected to reduce rates by 100 bps. Nevertheless, market participants priced ahead of the Jackson Hole Symposium in the first cut until the July meeting.
In the short term, this could be bearish for the GBP/USD, but an improvement in risk appetite could boost Sterling's prospects.
GBP/USD Price Forecast: Technical outlook
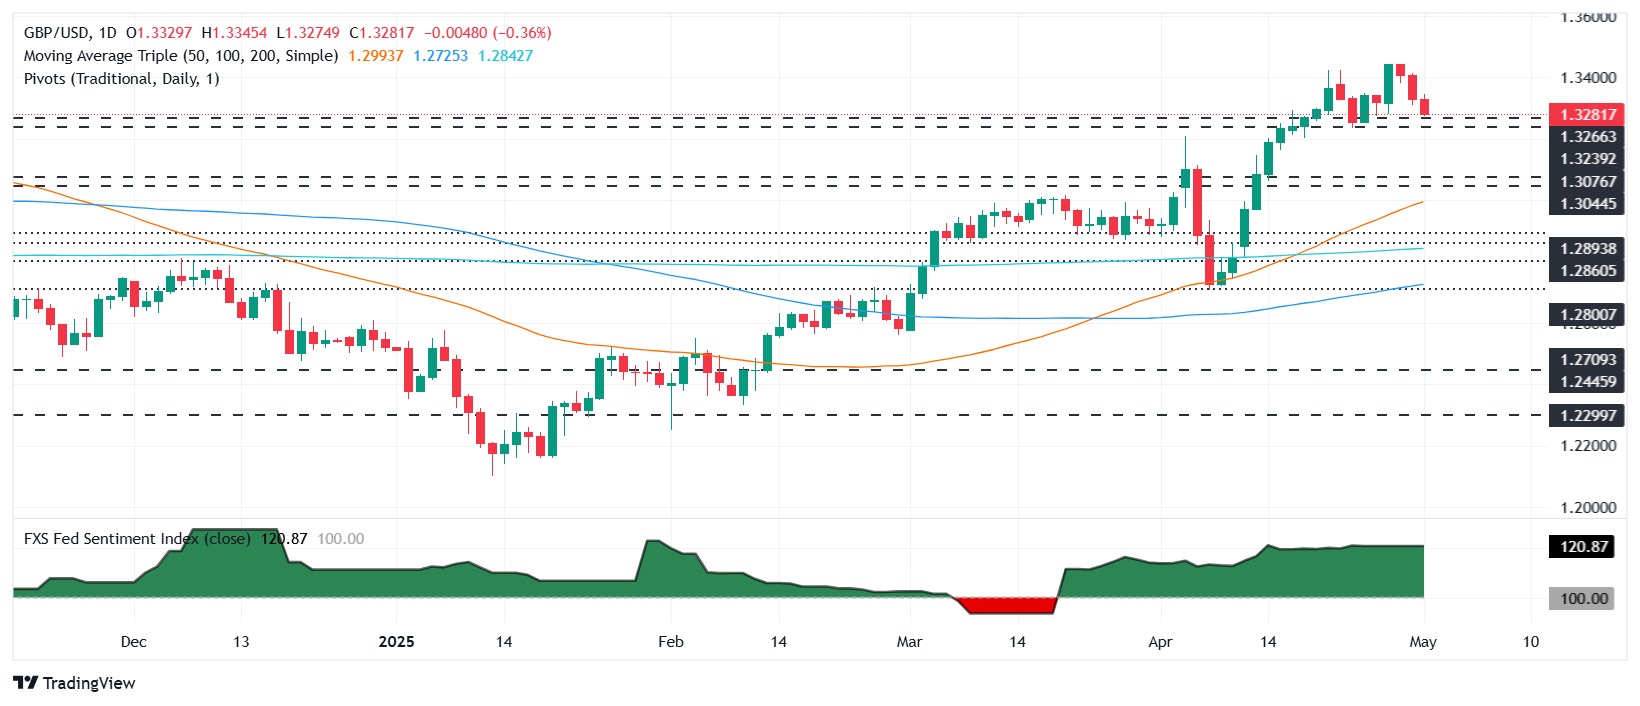
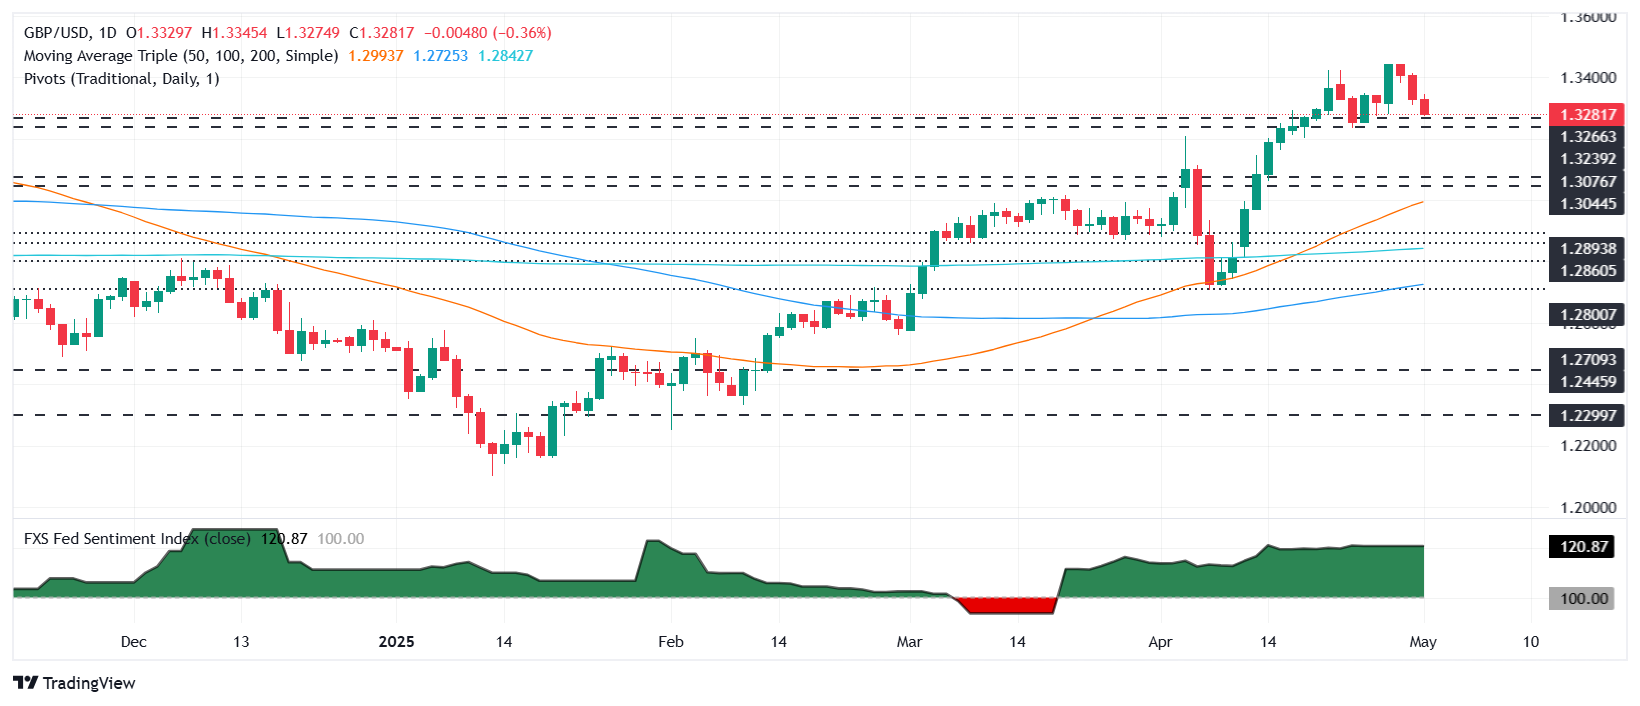
The GBP/USD extended its losses for the third straight day beneath the 20-day Simple Moving Average (SMA) of 1.3319 and cleared the 1.3300 figure as it hit a daily low of 1.3274. The pair has stabilized as of writing, but sellers seem to be gathering momentum. Despite the fact that the Relative Strength Index (RSI) is bullish, its downward move has accelerated towards its neutral line.
The next support will be the 1.3250 figure, followed by the 1.3200 mark. Conversely, if GBP/USD climbs past 1.3300, the next resistance would be the May 1 peak at 1.3345, followed by the April 30 high at 1.3414.
British Pound PRICE Today
The table below shows the percentage change of British Pound (GBP) against listed major currencies today. British Pound was the strongest against the Japanese Yen.
| USD | EUR | GBP | JPY | CAD | AUD | NZD | CHF | |
|---|---|---|---|---|---|---|---|---|
| USD | 0.50% | 0.36% | 1.72% | 0.33% | 0.35% | 0.51% | 0.82% | |
| EUR | -0.50% | -0.13% | 1.21% | -0.20% | -0.15% | -0.01% | 0.31% | |
| GBP | -0.36% | 0.13% | 1.31% | -0.03% | -0.02% | 0.12% | 0.44% | |
| JPY | -1.72% | -1.21% | -1.31% | -1.39% | -1.36% | -1.27% | -0.97% | |
| CAD | -0.33% | 0.20% | 0.03% | 1.39% | 0.03% | 0.15% | 0.48% | |
| AUD | -0.35% | 0.15% | 0.02% | 1.36% | -0.03% | 0.13% | 0.46% | |
| NZD | -0.51% | 0.01% | -0.12% | 1.27% | -0.15% | -0.13% | 0.32% | |
| CHF | -0.82% | -0.31% | -0.44% | 0.97% | -0.48% | -0.46% | -0.32% |
The heat map shows percentage changes of major currencies against each other. The base currency is picked from the left column, while the quote currency is picked from the top row. For example, if you pick the British Pound from the left column and move along the horizontal line to the US Dollar, the percentage change displayed in the box will represent GBP (base)/USD (quote).
Recommended Articles


