
Bitcoin Weekly Forecast: BTC steadies above $116,000 as FOMC dovish stance boosts risk-on sentiment
- Bitcoin price extends its three-week recovery, holding above $116,000 on Friday.
- The Federal Reserve’s 25 bps interest rate cut and prospects of two more cuts this year lifts risk-on sentiment across markets.
- Institutional demand strengthen with more than $660 million in inflows into BTC spot ETFs so far this week, while Strategy and others add to BTC holdings.
Bitcoin (BTC) shows strength, continuing its three consecutive weeks of recovery and holding steady above $116,000 at the time of writing on Friday. The recovery extends following the dovish Federal Reserve (Fed) stance, highlighted by a 25 basis points (bps) interest rate cut and expectations of further easing in 2025, which has fueled risk-on sentiment. Additionally, institutional and corporate demand adds further strength to BTC’s bullish outlook.
Fed’s interest rate decision supports BTC price
Bitcoin price started the week on a positive note, extending its gains and closing above $117,000 on Thursday. The positive price action of BTC followed the Federal Open Market Committee’s (FOMC) 25 bps rate cut on Wednesday, to the 4.0%-4.25% range, which fueled risk appetite across crypto markets.
Market participants largely anticipated the 25 bps rate cut. Still, attention centered on the FOMC’s latest Summary of Economic Projections (SEP), also known as the dot plot, which indicates that interest rates would average 3.6% by the end of 2025, below the June projection of 3.9%.
If this forecast comes true, the Fed could implement two additional 25-bps rate cuts or a single 50-bps cut in the remainder of the year, after trimming the interest rate by 25 bps on Wednesday. Moreover, in 2026, rates are projected to drop to 3.4% from the previous 3.6% and to 3.1% in 2027, below the 3.4% projected in the June dot plot. The longer-term forecast remains at 3%.
This dovish stance by the Fed triggered a risk-on sentiment, supporting riskier assets such as BTC. When writing on Friday, BTC is holding above $116,000.
Institutional and corporate demand strengthen
Bitcoin price recovery has been supported by institutional and corporate investors so far this week. SoSoValue data show that Bitcoin spot Exchange Traded Funds (ETFs) recorded a total of $664.03 million by Thursday, marking its fourth consecutive week of positive flows. If this inflow continues and intensifies, BTC could experience further price recovery.
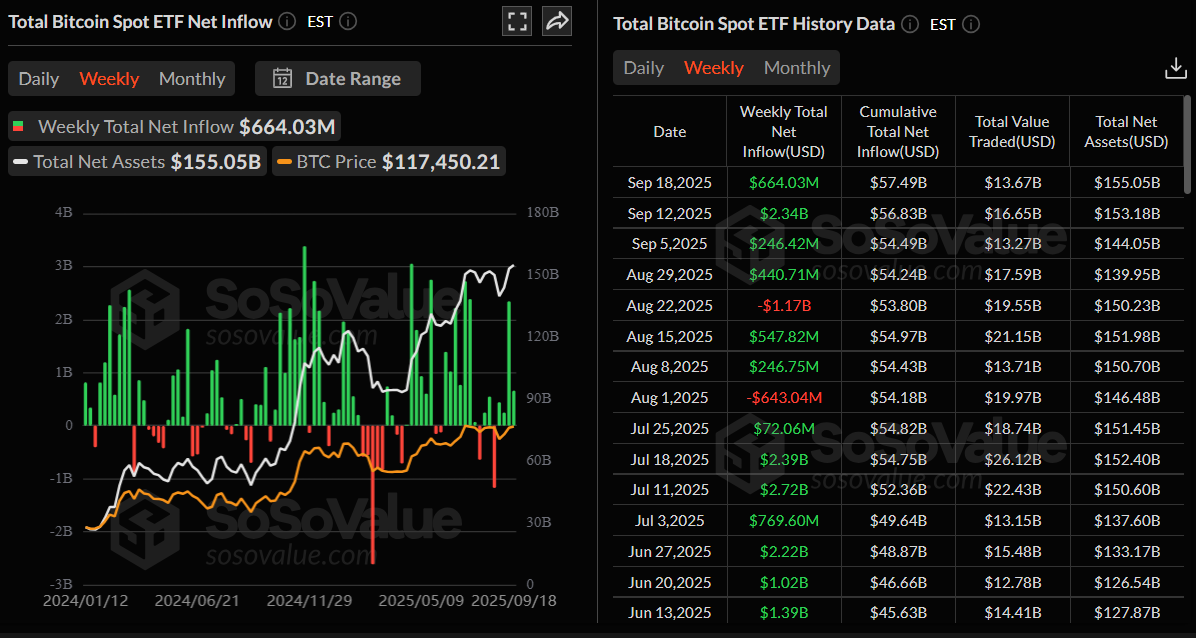
Total Bitcoin spot ETF net inflow chart. Source: SoSoValue
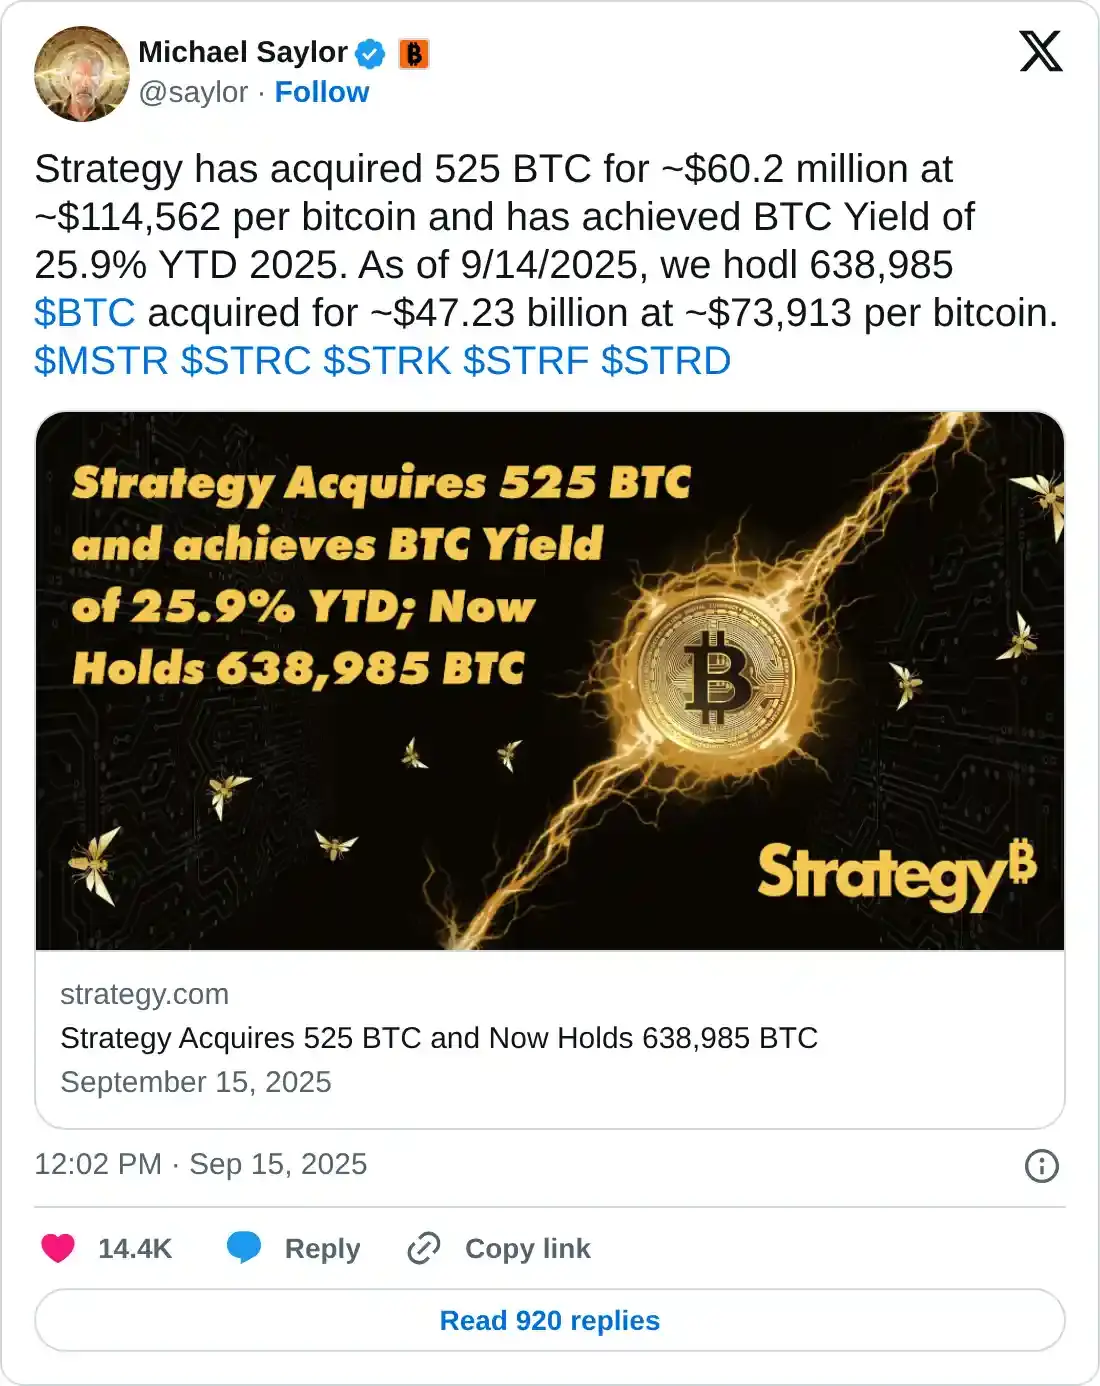
On the corporate front, demand continues to grow as Strategy co-founder Michael Saylor announced on social network X on Monday that his company had added 525 BTC to its reserve, bringing the total holding to 638,985 BTC. During the same period, other firms, including Capital B and Prenetics, also added a total of 88.6 BTC.
Additionally, NEXT Technology Holding Inc. has filed a Form S-3 registration statement with the US Securities and Exchange Commission (SEC), seeking to raise up to $500 million through a shelf offering. The company intends to use the proceeds for general corporate purposes, including working capital, research and development expenses, potential acquisitions, and the purchase of Bitcoin.
Mixed signals from on-chain metrics
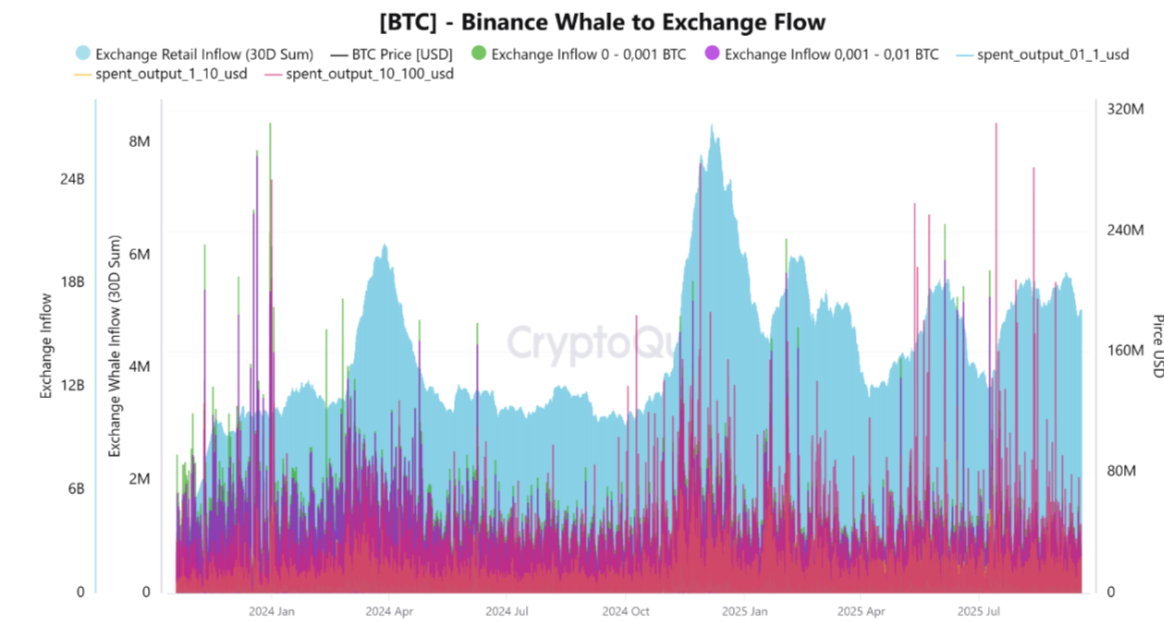
CryptoQuant data shows that BTC exhibits mixed signals on on-chain metrics, indicating indecisiveness among traders.
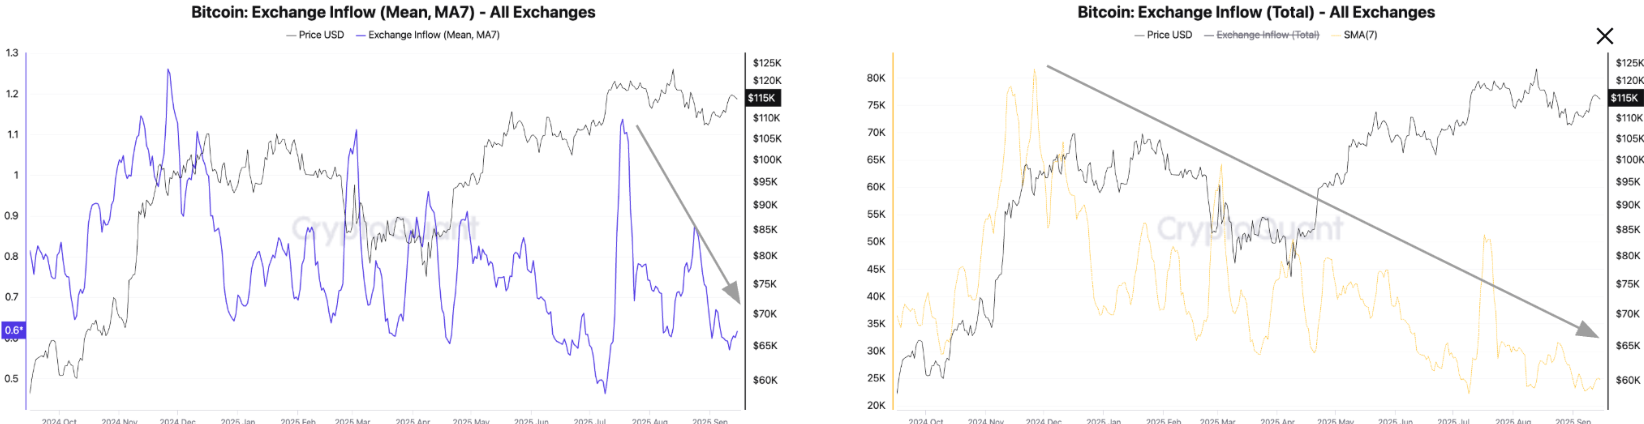
For the bullish case, Bitcoin selling pressure remains at low levels, as large deposits into exchanges decline. The chart below shows that the total Bitcoin flowing into exchanges has declined to a 7-day moving average value of 25,000 BTC, one of the lowest levels in over a year, and a significant drop from 51,000 BTC in July 17, when Bitcoin was trading around $120,000 for the first time ever.
Additionally, the average exchange deposit amount has declined to as low as 0.57 BTC so far in September from 1.14 BTC in July 18, highlighting reduced selling pressure.
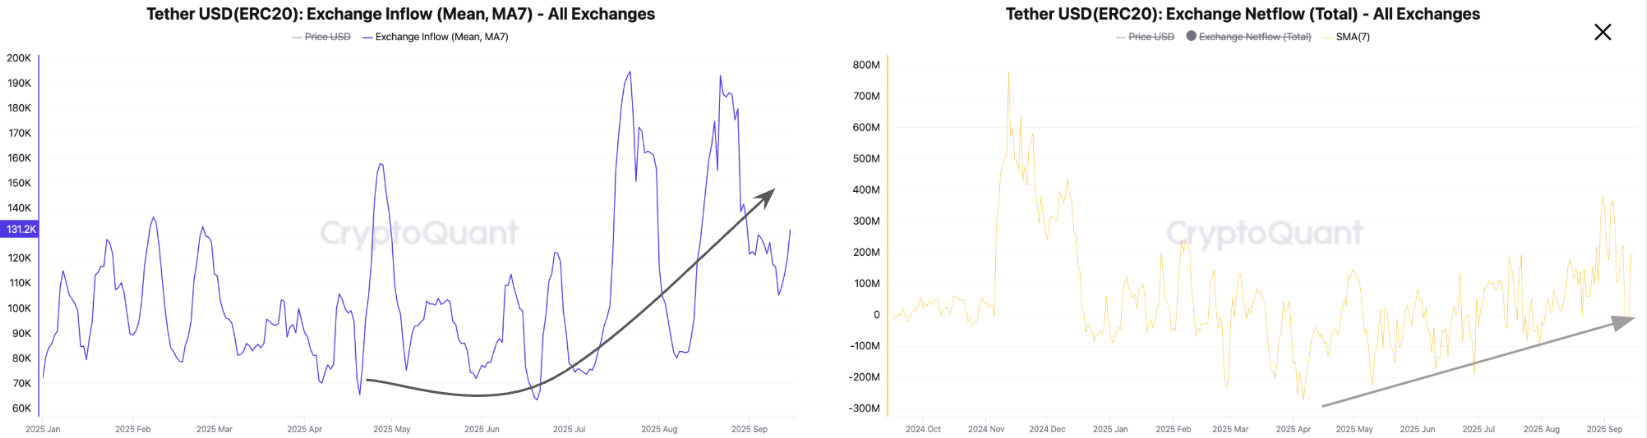
Apart from this, the dry powder necessary for a crypto rally is expanding, with total deposits of USDT into exchanges growing as large investors position themselves ahead of the Fed decision. The Net USDT deposits rose from $273 million on April 6 to $379 million on August 31, the highest level this year. The higher amount of USDT flowing into exchanges is driven by large deposits, as the average daily deposit has increased to $130,000 on Tuesday from a 2025 low of $63,000 in July.
For the bearish case, the chart below shows that the current market is driven by individuals rather than large wallets, indicating a retail-driven rather than a whale-driven market.
The wallets holding (0 to 0.001) BTC recorded approximately 97,000 BTC, while inflows in the (0.001 to 0.01) BTC wallets amounted to about 719,000 BTC from early September till Wednesday. This accumulation pattern highlights that retail investors are currently driving the market through numerous small-volume transactions, supporting a gradual climb toward $120,000. However, traders should remain cautious, as a sudden influx of whale activity could swiftly trigger a correction and shift market direction.
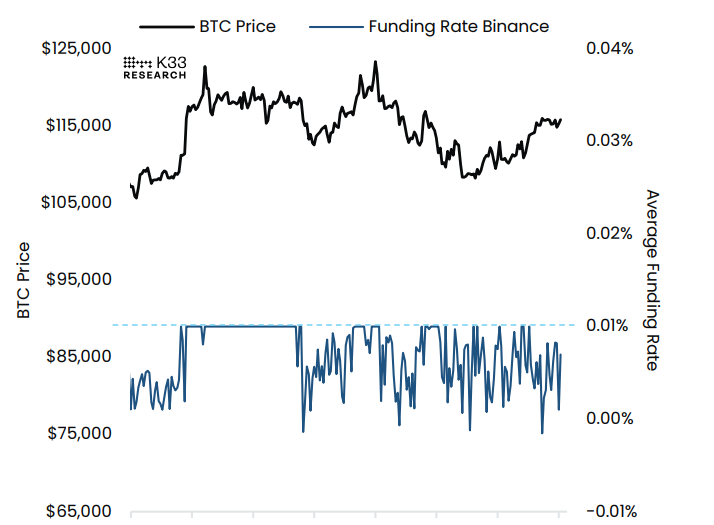
Moreover, the market remains undecided, according to a K33 report released this week. Funding rates maintain an erratic pattern, hovering below neutral levels as traders remain reluctant to add long exposure.
US SEC approves first US multi-asset crypto ETP
The US Securities and Exchange Commission announced on Wednesday the approval of generic listing standards for commodity-based trust shares on Nasdaq, Cboe, and the NYSE, allowing these exchanges to list such products without going through the normal ETF approval process.
“This approval helps to maximize investor choice and foster innovation by streamlining the listing process and reducing barriers to access digital asset products within America’s trusted capital markets,” said SEC Chairman Paul S. Atkins.
In addition to approving the generic listing standards, the Commission approved the listing and trading of the Grayscale Digital Large Cap Fund (GDLC), which holds spot digital assets based on the CoinDesk 5 Index. The fund will offer exposure to five of the world’s largest cryptocurrencies: Bitcoin (BTC), Ethereum(ETH), Ripple (XRP), Solana (SOL), and Cardano (ADA).
Technical outlook: Will BTC recovery extend to new all-time highs?
On the weekly chart, Bitcoin is extending its three-week recovery since early September, with gains of 1.3% so far this week as of Friday.
If BTC continues its upward momentum, it could extend the rally towards the psychological level at $120,000. A successful close above this level could extend the gains toward the record high at $124,474.
The Relative Strength Index (RSI) on the weekly chart stands at 60, above its neutral level of 50, and is pointing upward, indicating that bullish momentum is gaining traction. However, the Moving Average Convergence Divergence (MACD) exhibited a bearish crossover at the end of August, which remains in effect.
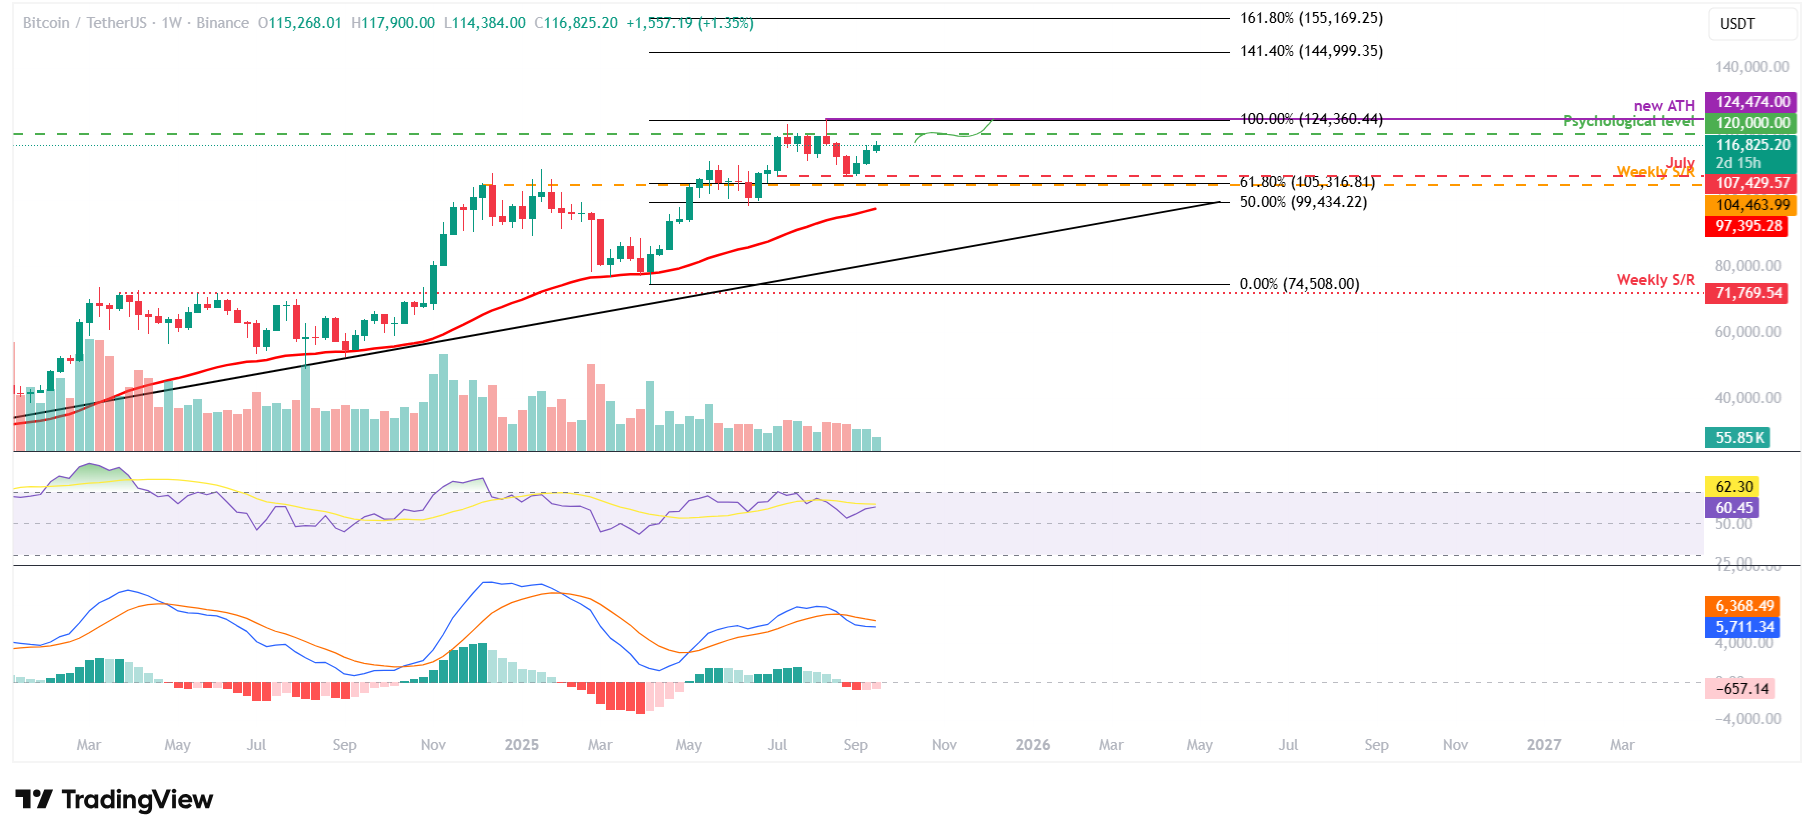
BTC/USDT weekly chart
On the daily chart, Bitcoin price broke above the 50-day Exponential Moving Average (EMA) on September 10 and rallied 2.43% over the next six days, closing above the $116,000 resistance level on Tuesday before facing a slight rejection on Wednesday. At the time of writing on Friday, BTC trades at around $116,700.
If BTC continues its upward momentum, it could extend the rally toward the psychological level of $120,000.
The RSI on the daily chart reads 59, remaining steady above the midline and reflecting bullish momentum. The MACD indicator on the same chart displayed a bullish crossover on September 6, which remains in effect, indicating sustained bullish momentum and an upward trend ahead.
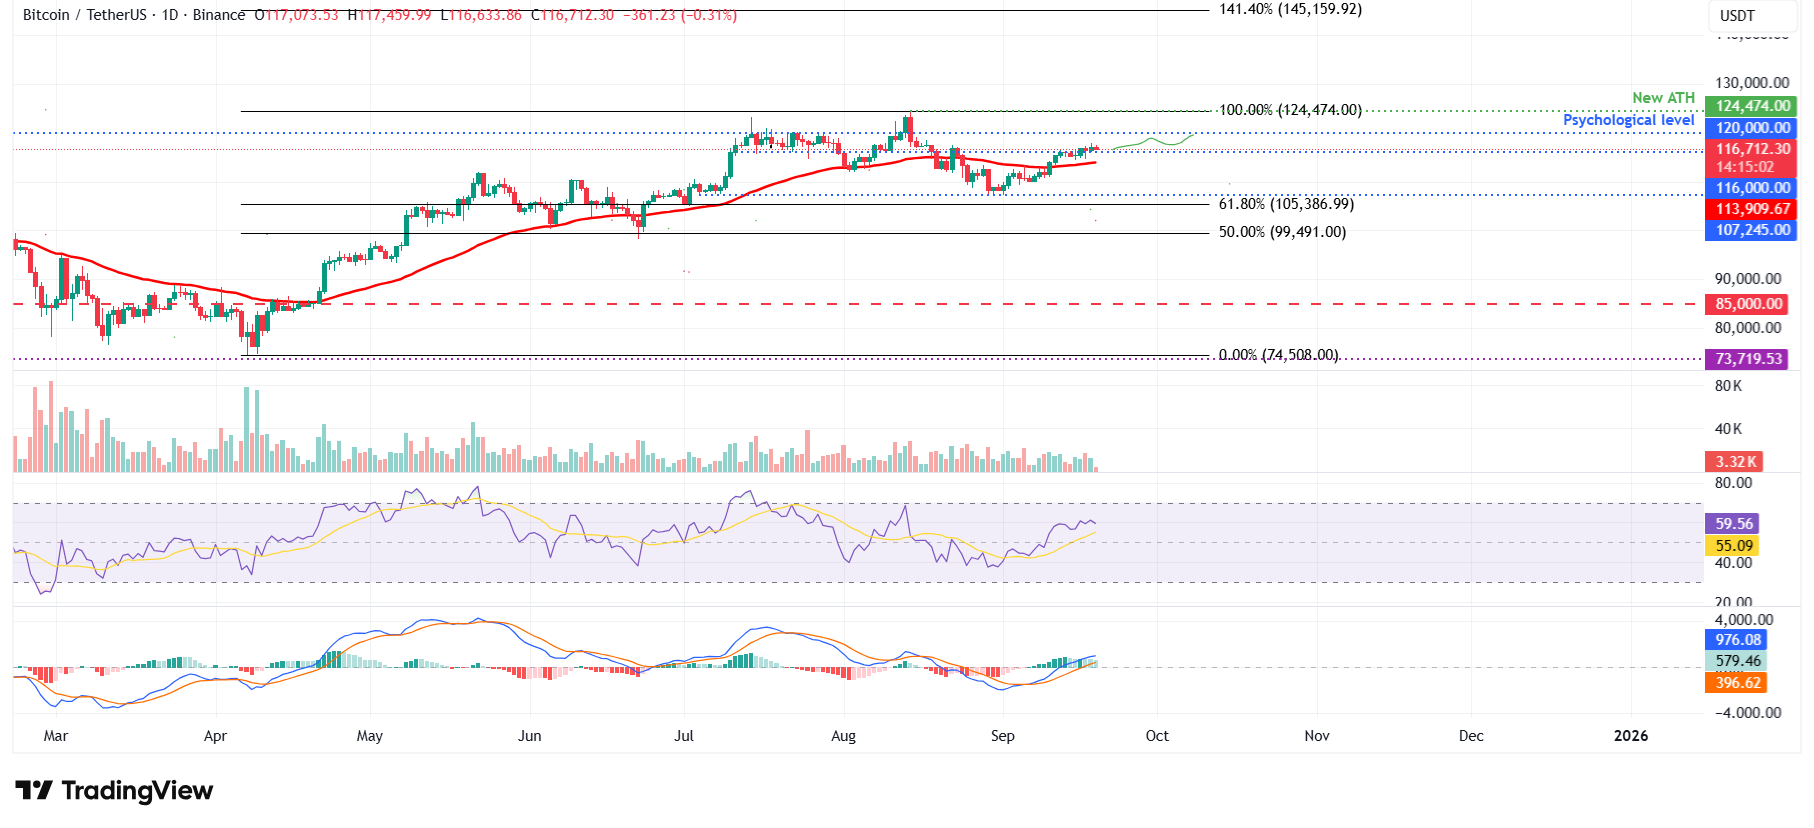
BTC/USDT daily chart
On the contrary, if BTC corrects and closes below the $116,000 support level, it could extend the decline toward the 50-day Exponential Moving Average (EMA) at $113,909.
Bitcoin, altcoins, stablecoins FAQs
Bitcoin is the largest cryptocurrency by market capitalization, a virtual currency designed to serve as money. This form of payment cannot be controlled by any one person, group, or entity, which eliminates the need for third-party participation during financial transactions.
Altcoins are any cryptocurrency apart from Bitcoin, but some also regard Ethereum as a non-altcoin because it is from these two cryptocurrencies that forking happens. If this is true, then Litecoin is the first altcoin, forked from the Bitcoin protocol and, therefore, an “improved” version of it.
Stablecoins are cryptocurrencies designed to have a stable price, with their value backed by a reserve of the asset it represents. To achieve this, the value of any one stablecoin is pegged to a commodity or financial instrument, such as the US Dollar (USD), with its supply regulated by an algorithm or demand. The main goal of stablecoins is to provide an on/off-ramp for investors willing to trade and invest in cryptocurrencies. Stablecoins also allow investors to store value since cryptocurrencies, in general, are subject to volatility.
Bitcoin dominance is the ratio of Bitcoin's market capitalization to the total market capitalization of all cryptocurrencies combined. It provides a clear picture of Bitcoin’s interest among investors. A high BTC dominance typically happens before and during a bull run, in which investors resort to investing in relatively stable and high market capitalization cryptocurrency like Bitcoin. A drop in BTC dominance usually means that investors are moving their capital and/or profits to altcoins in a quest for higher returns, which usually triggers an explosion of altcoin rallies.
Recommended Articles


