

Dow Jones Industrial Average backslides on Friday as tech stock pullback drags down indices
- Dow Jones follows other indices lower on Friday.
- UoM Consumer Sentiment Index ticked lower.
- June rate cut bets have edged down to 60%.
The Dow Jones Industrial Average (DJIA) is down a little over half a percent as markets round the corner into the Friday closing bell with US equities broadly lower on the day. An extended pullback in the tech and telecoms sectors are dragging down the averages, with limited gains to keep the Dow Jones on-balance as markets buckle down for the weekend.
According to the CME’s FedWatch Tool, rate futures are pricing in nearly a 41% chance of no rate movement from the Federal Reserve (Fed) at the US central bank’s June rate call. Money markets see an over 90% chance of no rate cuts from the Fed at both the March and May rate statements. The Fed’s next rate call and update to the Fed’s in-houser Dot Plot summary of rate projections are due next week at 1800 GMT on Wednesday.
The Technology Sector has extended into a four-day pullback after peaking on Monday, shedding an additional 1.4% on Friday. A 1.2% decline in the Communications Services Sector follows closely behind the Tech Sector’s pullback.\
The Materials and Industrials Sectors are in the green on Friday but doing little to counterbalance headline losses, gaining a scant 0.22% and 0.11%, respectively.
Dow Jones news
Most of the equities listed on the Dow Jones Industrial Average (DJIA) were in the red on Friday, with Microsoft Corp. (MSFT) and Salesforce Inc. (CRM) leading the losers, both shedding around 2.5%. Amazon Inc. (AMZN) followed close behind, down around 2.3% on the day.
Boeing Co. (BA) is seeing a brief reprieve from recent hard selling, rebounding 1.3% on Friday as 3M Co. (MMM) climbs around 1%. Of the 30 securities listed on the Dow Jones, over two-thirds are printing on the down side as markets prepare to exit for the weekend.
The Dow Jones Industrial Average is following its peer indices lower on Friday but is drowning slower than the others, falling around 0.6% on the day as the NASDAQ Composite sheds a full percentage point and the S&P 500 slides 0.7%.
Dow Jones Industrial Average technical outlook
The Dow Jones Industrial Average (DJIA) declined after facing an intraday rejection from a supply zone near the 39,000.00 major handle, marking in the day's bottom at 38,606.59. The index is still trading above the week's early low set on Monday near 38,470.00, but is still down 1.4% from the week's peak bids near 39,225.00.
The Dow Jones continues to churn near all-time highs set in February at 39,281.86, and the index is still up over 19% from October's lows near 32,475.00.
Dow Jones Industrial Average, 5-minute chart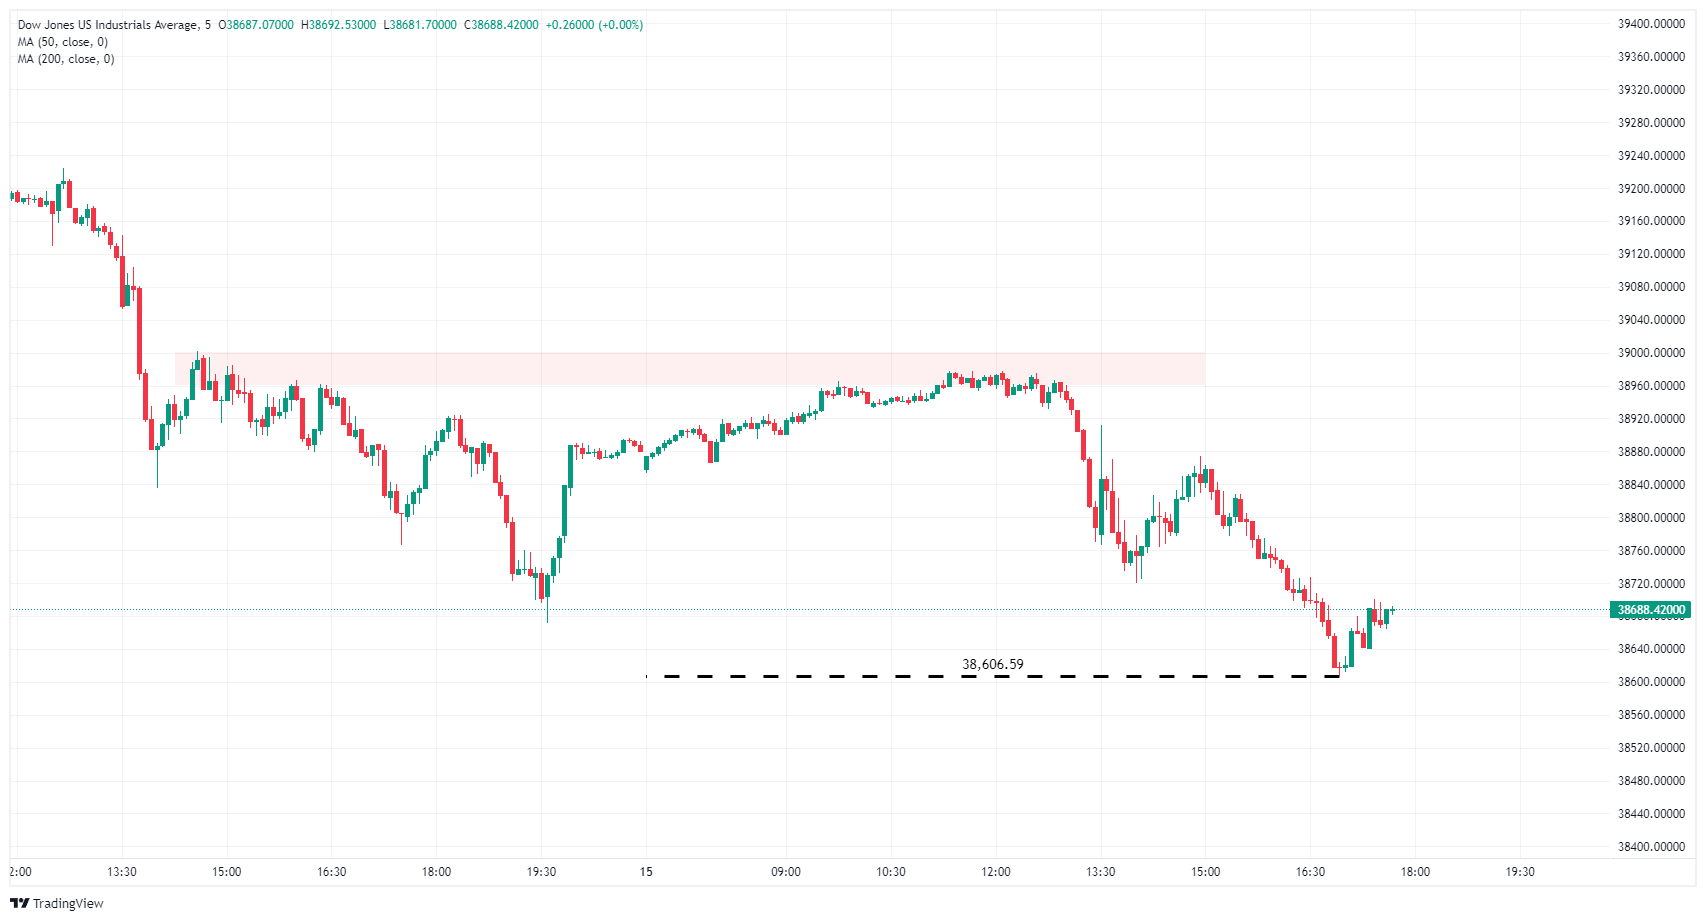
Dow Jones FAQs
The Dow Jones Industrial Average, one of the oldest stock market indices in the world, is compiled of the 30 most traded stocks in the US. The index is price-weighted rather than weighted by capitalization. It is calculated by summing the prices of the constituent stocks and dividing them by a factor, currently 0.152. The index was founded by Charles Dow, who also founded the Wall Street Journal. In later years it has been criticized for not being broadly representative enough because it only tracks 30 conglomerates, unlike broader indices such as the S&P 500.
Many different factors drive the Dow Jones Industrial Average (DJIA). The aggregate performance of the component companies revealed in quarterly company earnings reports is the main one. US and global macroeconomic data also contributes as it impacts on investor sentiment. The level of interest rates, set by the Federal Reserve (Fed), also influences the DJIA as it affects the cost of credit, on which many corporations are heavily reliant. Therefore, inflation can be a major driver as well as other metrics which impact the Fed decisions.
Dow Theory is a method for identifying the primary trend of the stock market developed by Charles Dow. A key step is to compare the direction of the Dow Jones Industrial Average (DJIA) and the Dow Jones Transportation Average (DJTA) and only follow trends where both are moving in the same direction. Volume is a confirmatory criteria. The theory uses elements of peak and trough analysis. Dow’s theory posits three trend phases: accumulation, when smart money starts buying or selling; public participation, when the wider public joins in; and distribution, when the smart money exits.
There are a number of ways to trade the DJIA. One is to use ETFs which allow investors to trade the DJIA as a single security, rather than having to buy shares in all 30 constituent companies. A leading example is the SPDR Dow Jones Industrial Average ETF (DIA). DJIA futures contracts enable traders to speculate on the future value of the index and Options provide the right, but not the obligation, to buy or sell the index at a predetermined price in the future. Mutual funds enable investors to buy a share of a diversified portfolio of DJIA stocks thus providing exposure to the overall index.
Recommended Articles


