

Cardano Selling Pressure Just Fell 50% — Is a Weekend ADA Rebound Next?
Cardano has struggled to build sustained upside in recent weeks. The asset is down roughly 4% over the past 24 hours and nearly 9% over the last 30 days, reflecting the broader weakness across the crypto market. Yet the timing of the latest metrics is notable.
As the market enters a weekend trading window, a period typically marked by thinner liquidity and faster reactions to technical signals, selling pressure across the Cardano network has dropped sharply. At the same time, a momentum shift is appearing on the chart. Together, these developments raise a key question: could Cardano attempt a weekend rebound?
Bullish Divergence Suggests a Weekend Reaction Could Come Quickly
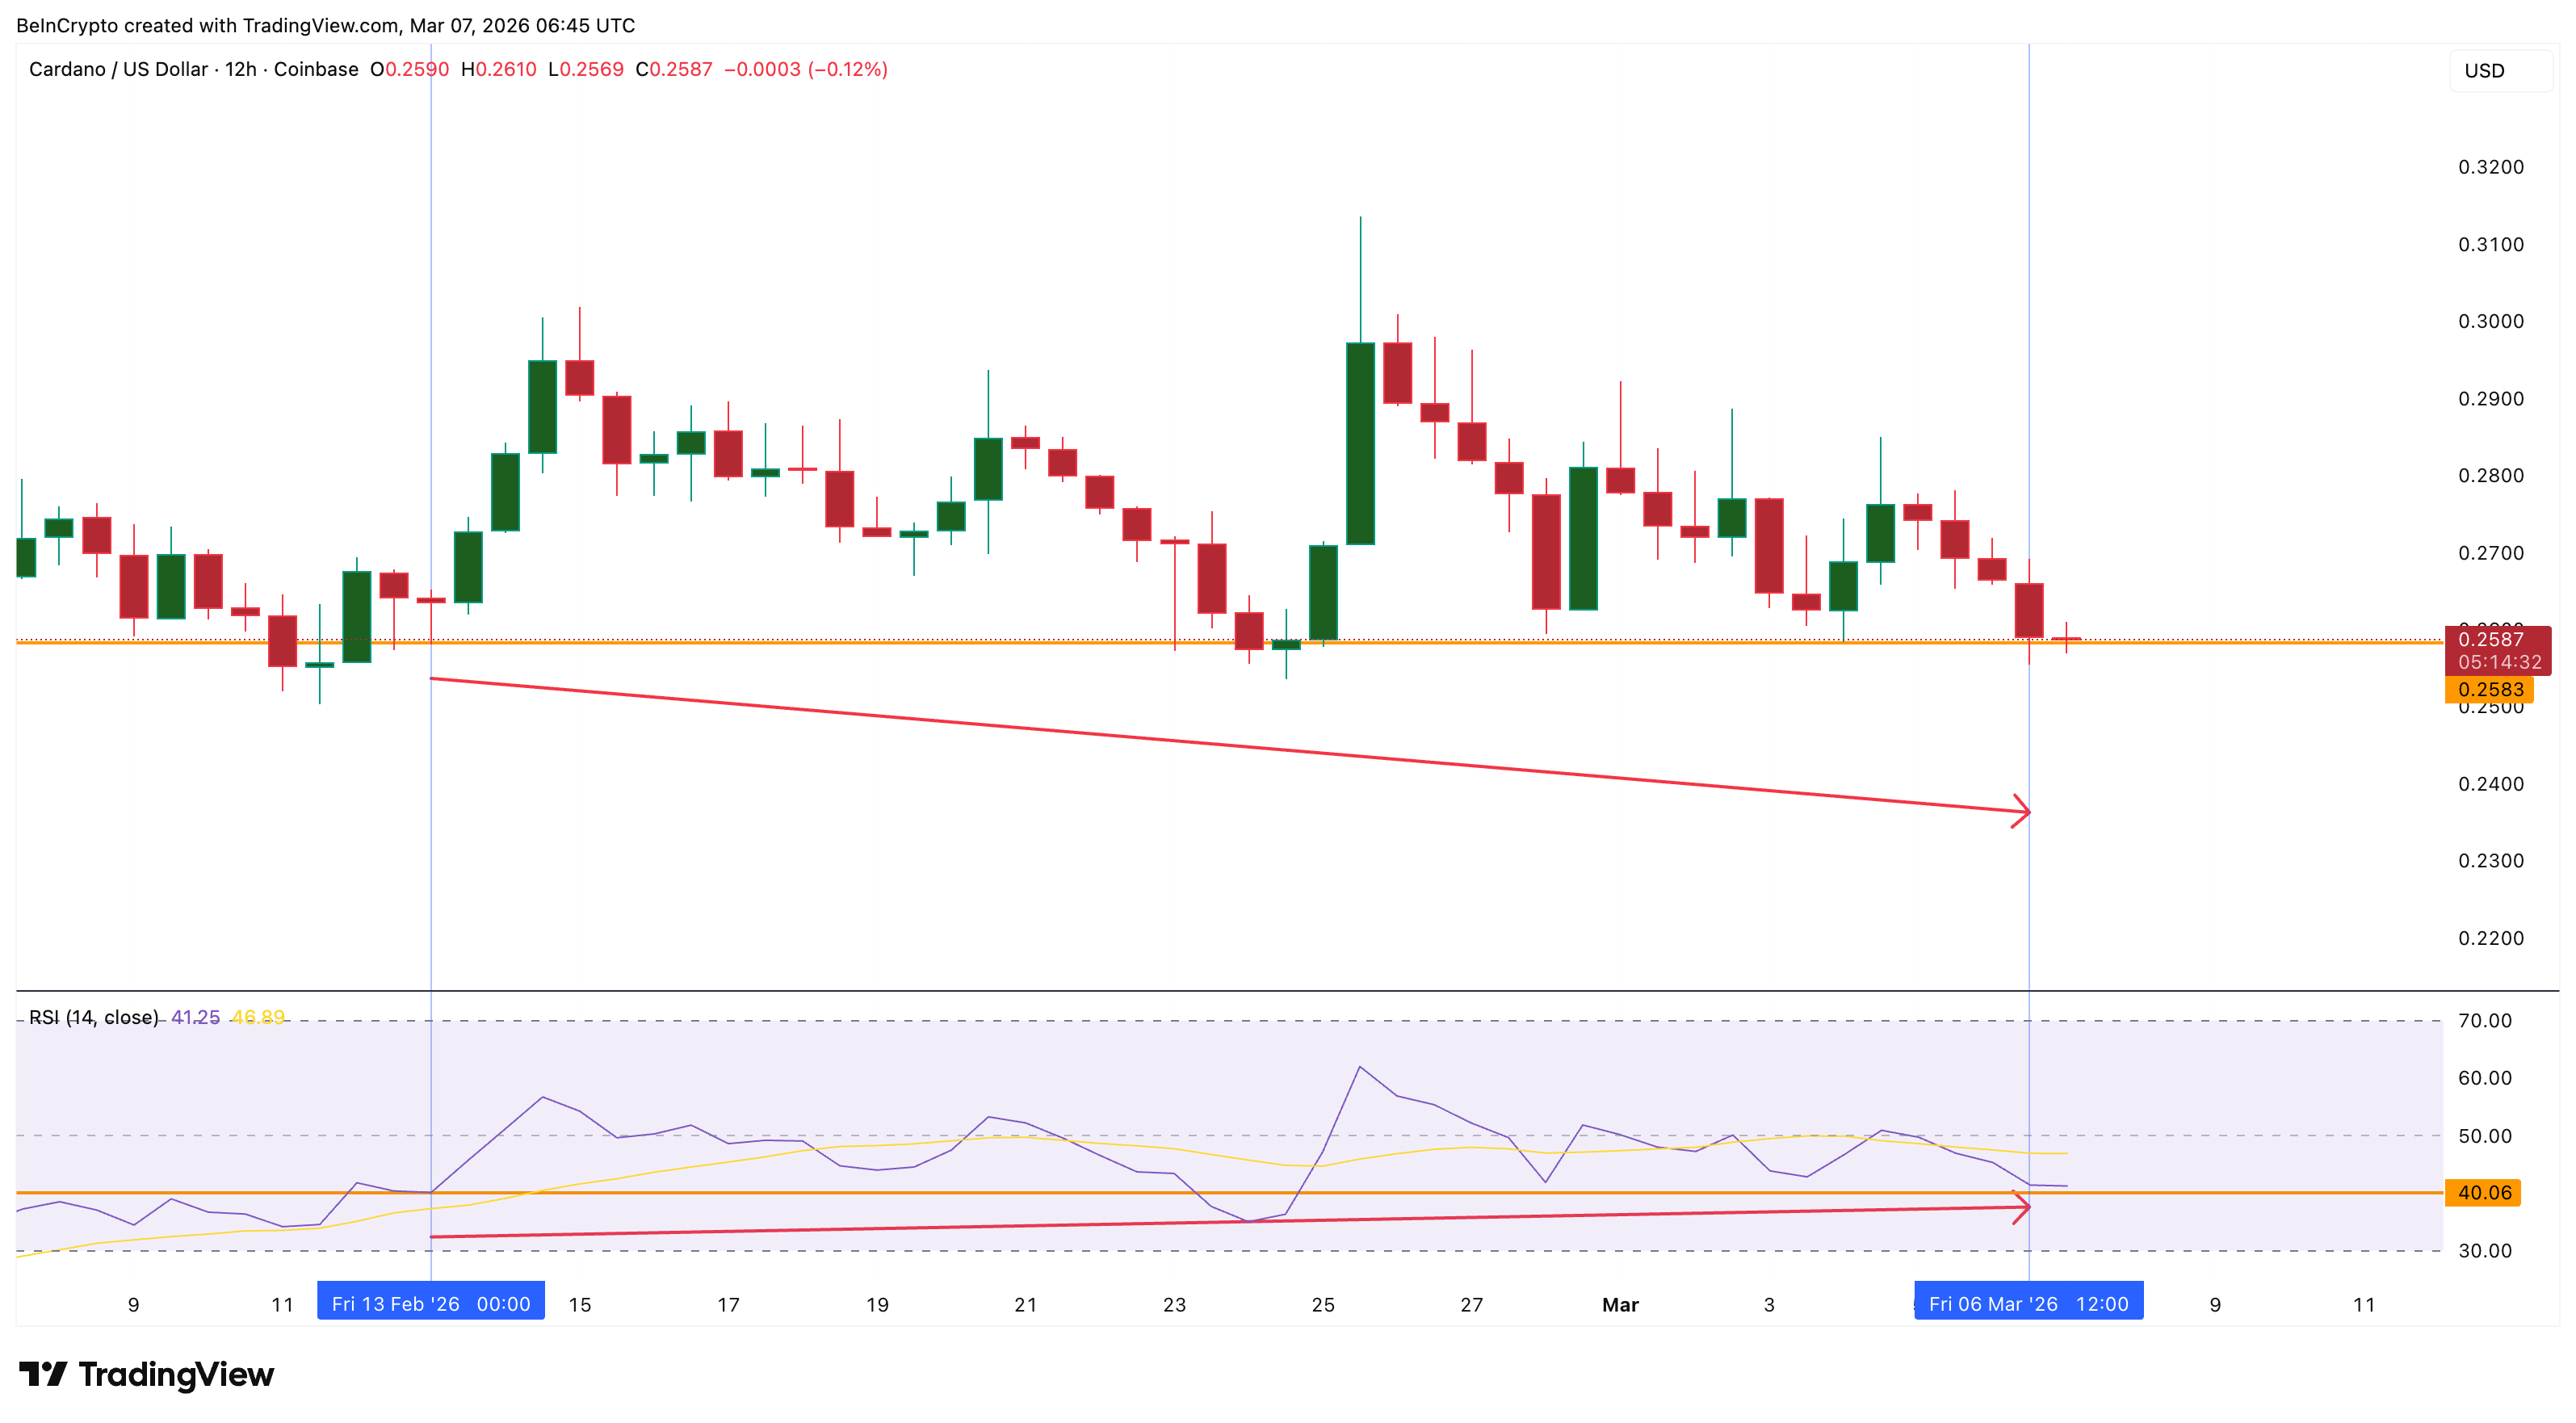
On the 12-hour chart, Cardano shows bullish divergence between price action and the Relative Strength Index (RSI), a momentum indicator.
Between February 13 and March 6, the Cardano price formed a lower low, while the RSI produced a slightly higher low. This structure often appears toward the end of declining phases when selling momentum begins to weaken.
Want more token insights like this? Sign up for Editor Harsh Notariya’s Daily Crypto Newsletter here.
 Cardano Divergence: TradingView
From a buyer–seller perspective, this pattern suggests that although prices continued falling, sellers were losing control of momentum while buyers slowly absorbed supply at lower levels. These types of divergences typically play out quickly once they appear, especially in low-liquidity periods such as weekend trading sessions.
In other words, if buyers react to the signal, the rebound tends to occur relatively fast rather than develop slowly.
But momentum signals alone rarely drive price movements. On-chain metrics now show another shift that may support the rebound thesis.
Profitability Bottom and 50% Drop in Selling Pressure Strengthen the Bounce Case
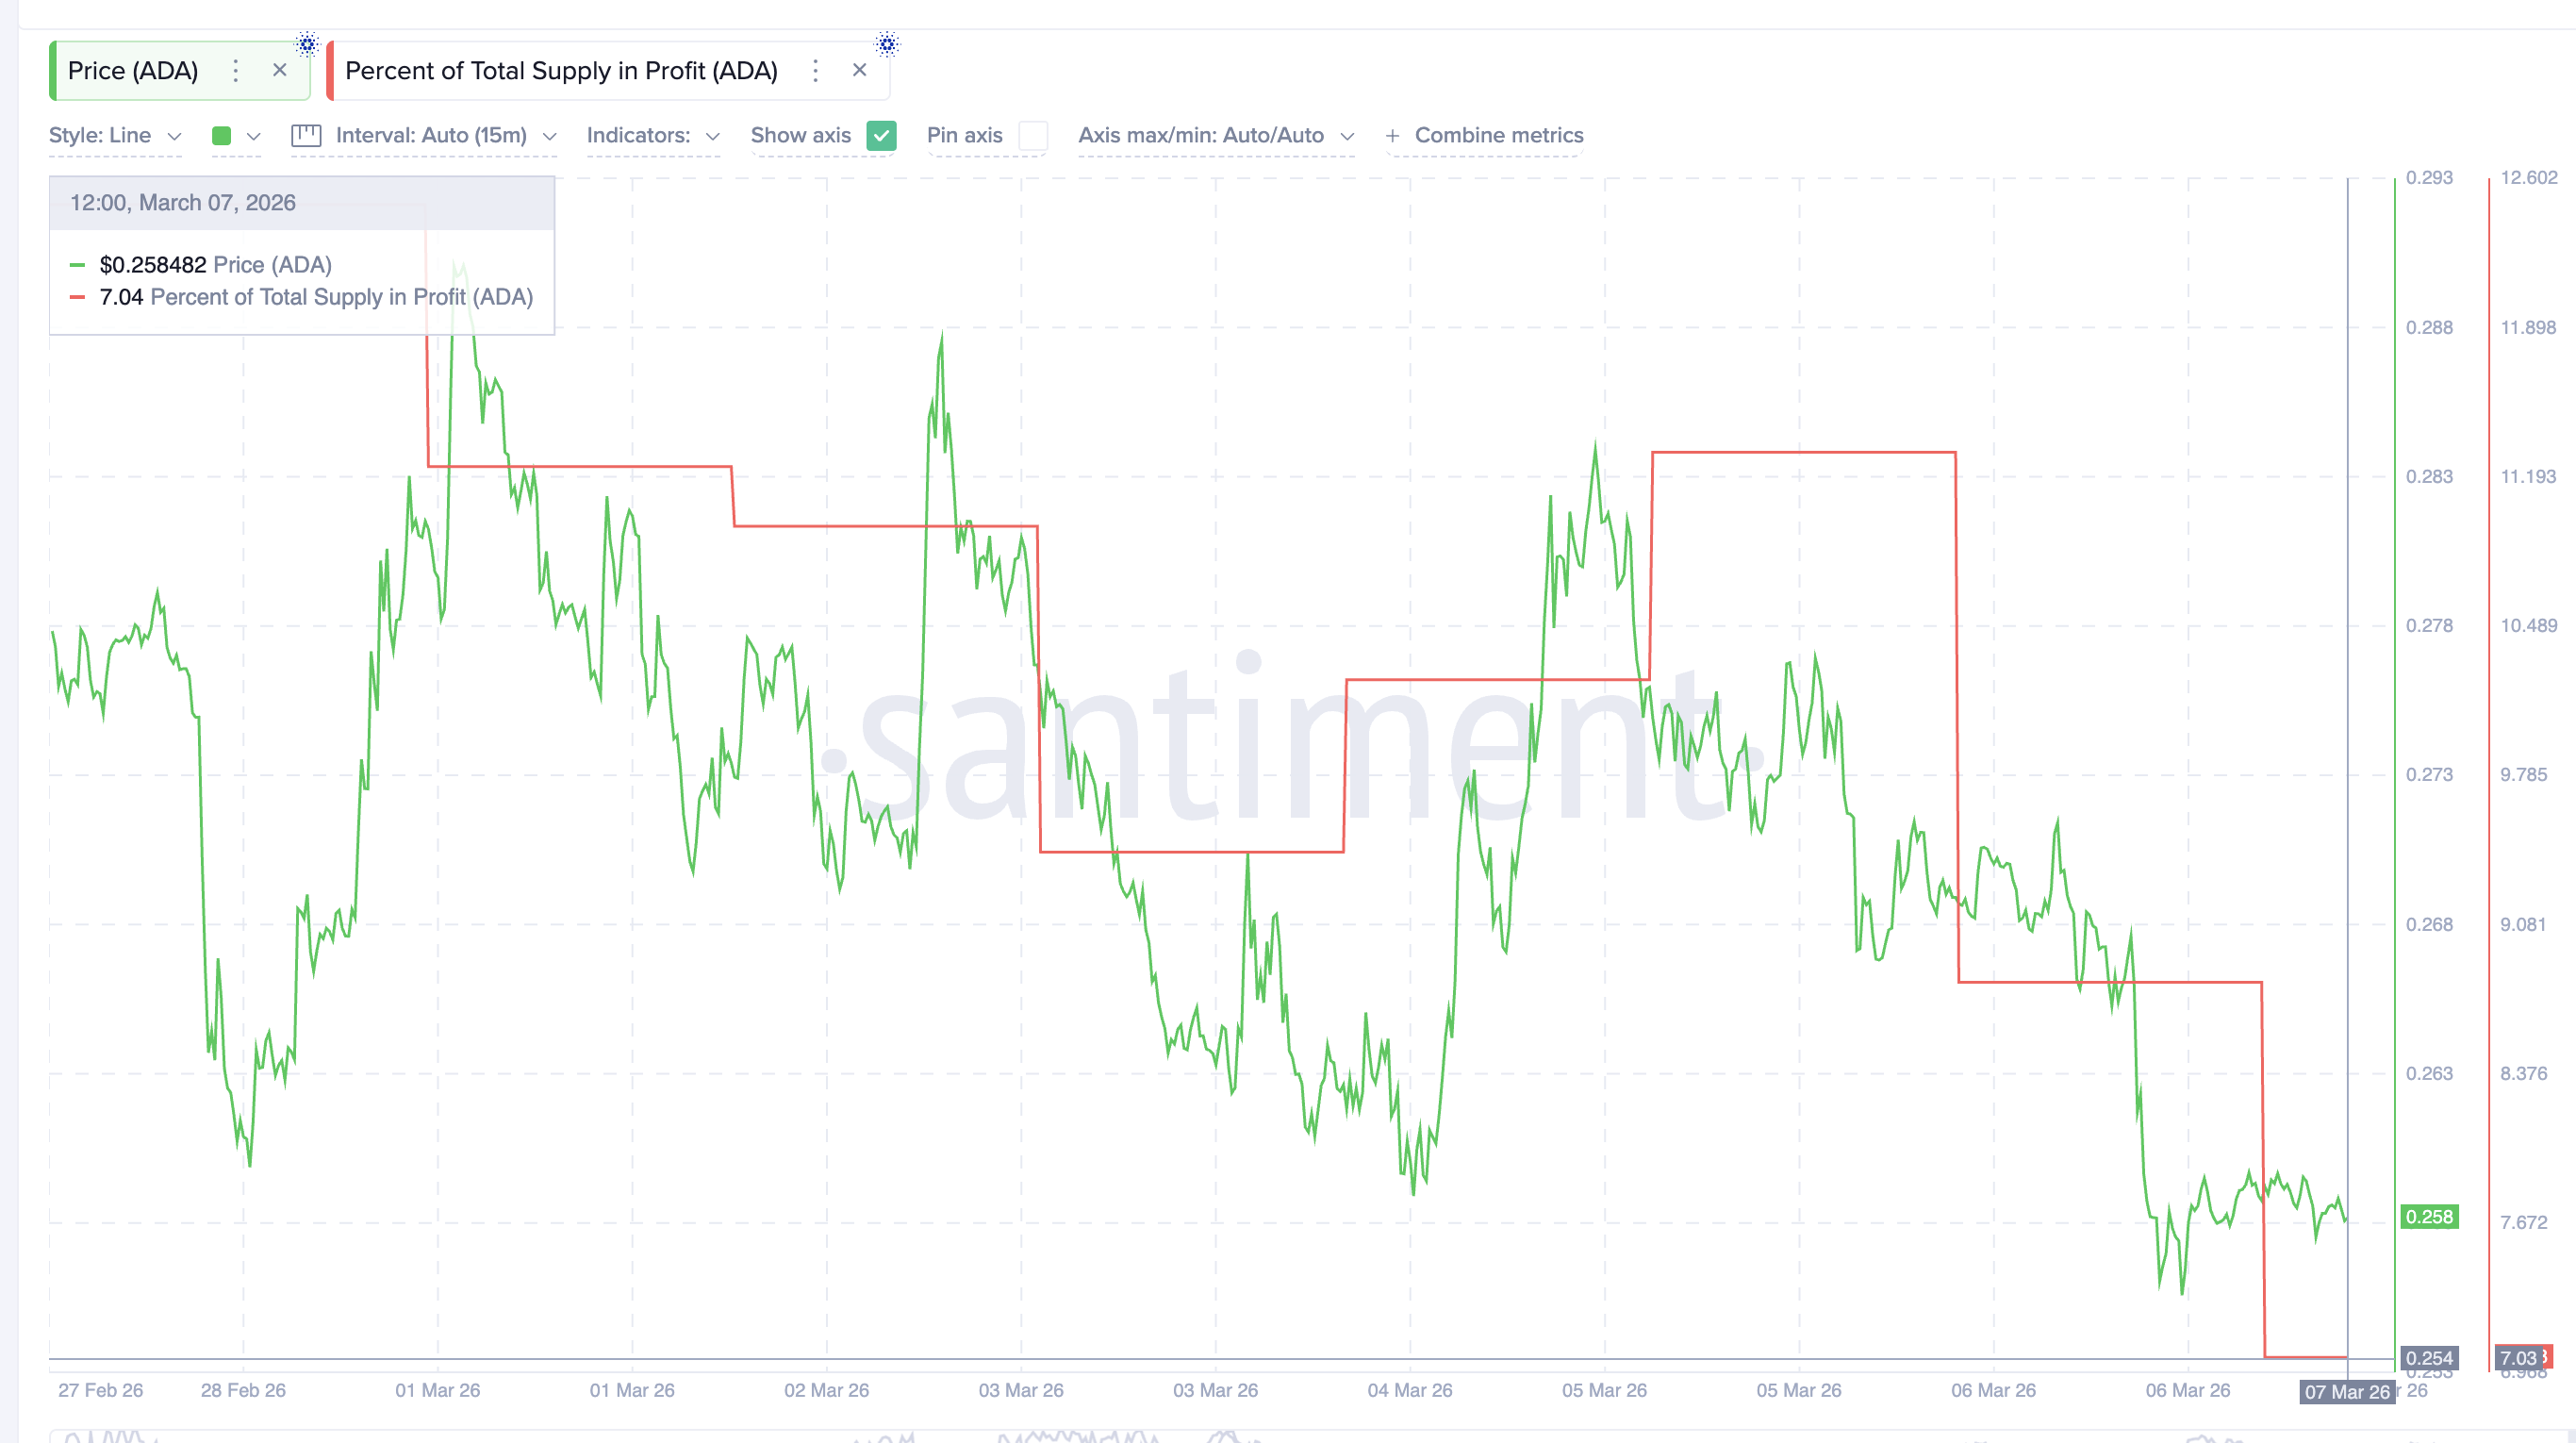
On-chain data reveals that the percentage of Cardano’s circulating supply currently in profit has recently reached another local bottom. This metric measures how many coins are held above their purchase price. When profitability drops, fewer investors remain in profit, which typically reduces the incentive to sell.
A similar situation appeared on March 4, when the metric dropped near 9.43% while Cardano traded around $0.26. Within a day, the price climbed toward $0.28, marking a rebound of roughly 8%.
 Profitability Dips: Santiment
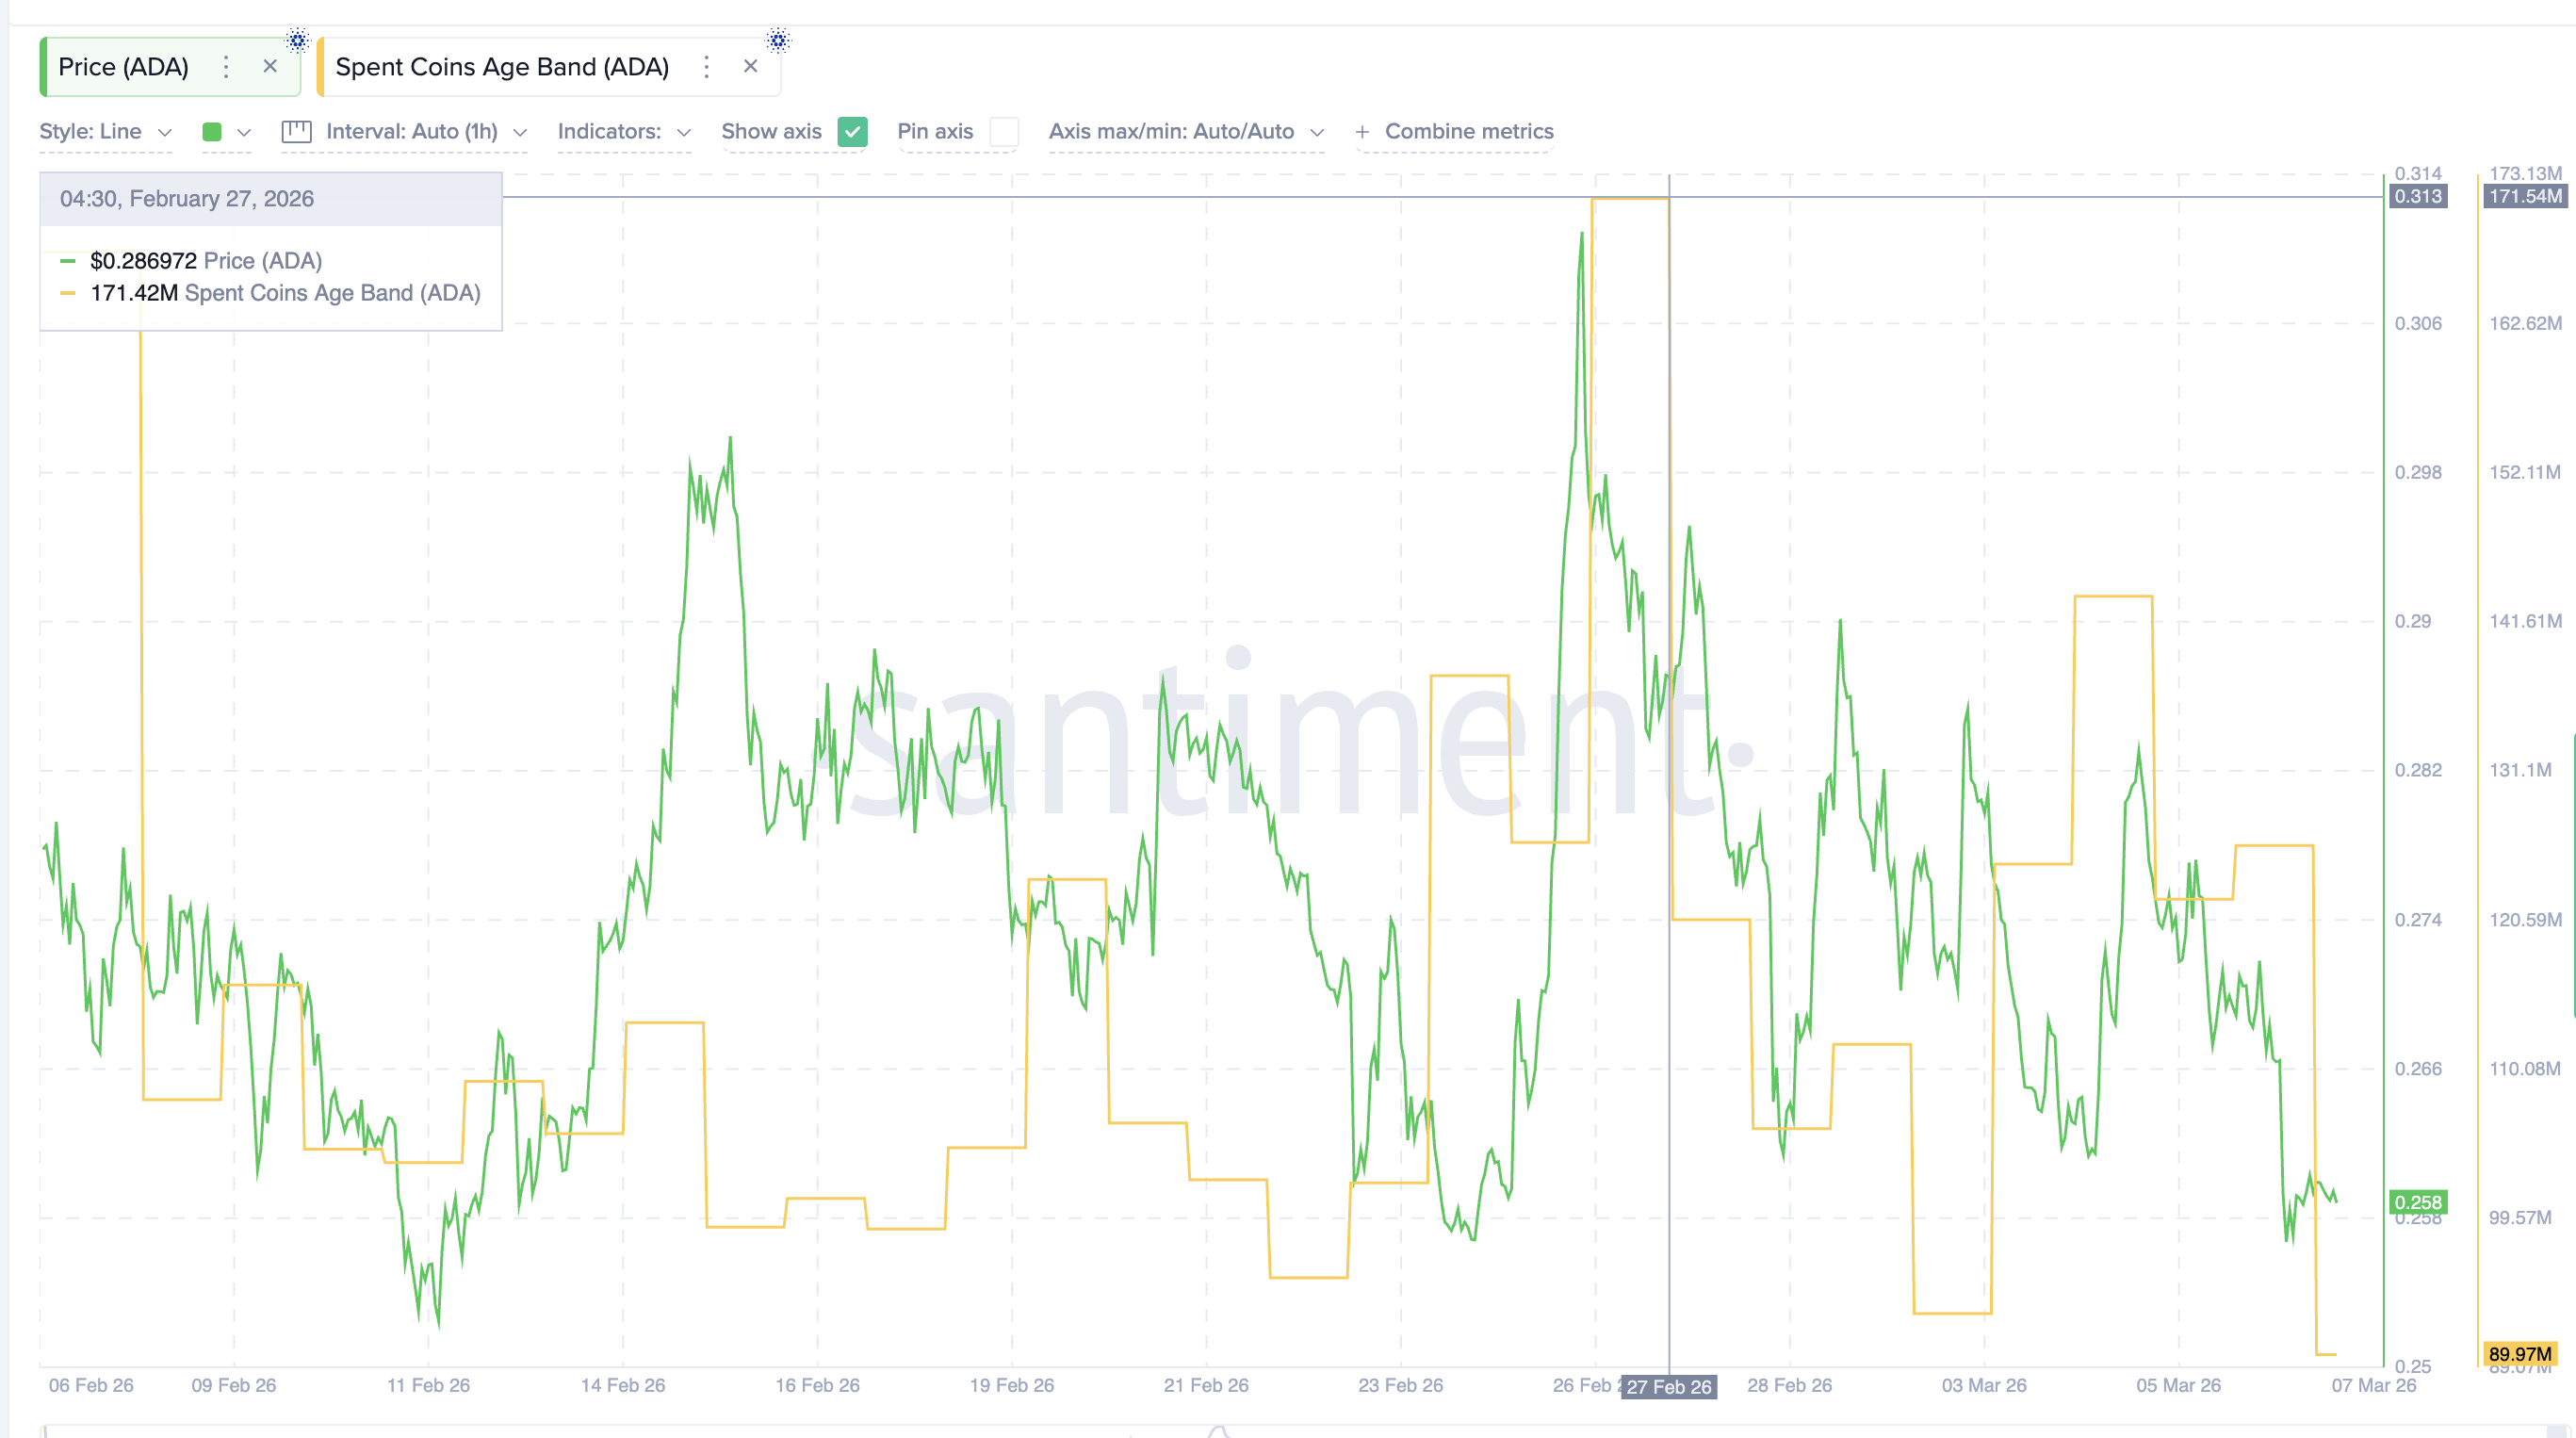
Now the metric has fallen again, declining from 11.3% on March 5 to around 7.03% at press time, forming another local low that could again support a rebound attempt. At the same time, selling pressure across the network has dropped sharply. Data from the Spent Coins Age Band metric — which tracks coins moving on-chain across all age groups and often reflects distribution activity — shows a dramatic slowdown.
The indicator peaked near 171.42 million coins on February 27 but has now dropped to roughly 89.97 million (a monthly low). That represents a decline of nearly 50% in selling pressure.
 Coin Activity Linked To Selling Dips: Santiment
When fewer coins move on-chain for potential distribution, it often suggests that holders are becoming less willing to sell at current price levels. This, in turn, could reduce immediate supply pressure in the market.
With both profitability and spending activity pointing toward declining selling pressure, attention now turns to the price levels that could determine whether Cardano manages a weekend rebound.
Cardano Price Levels That Could Decide the Weekend Move
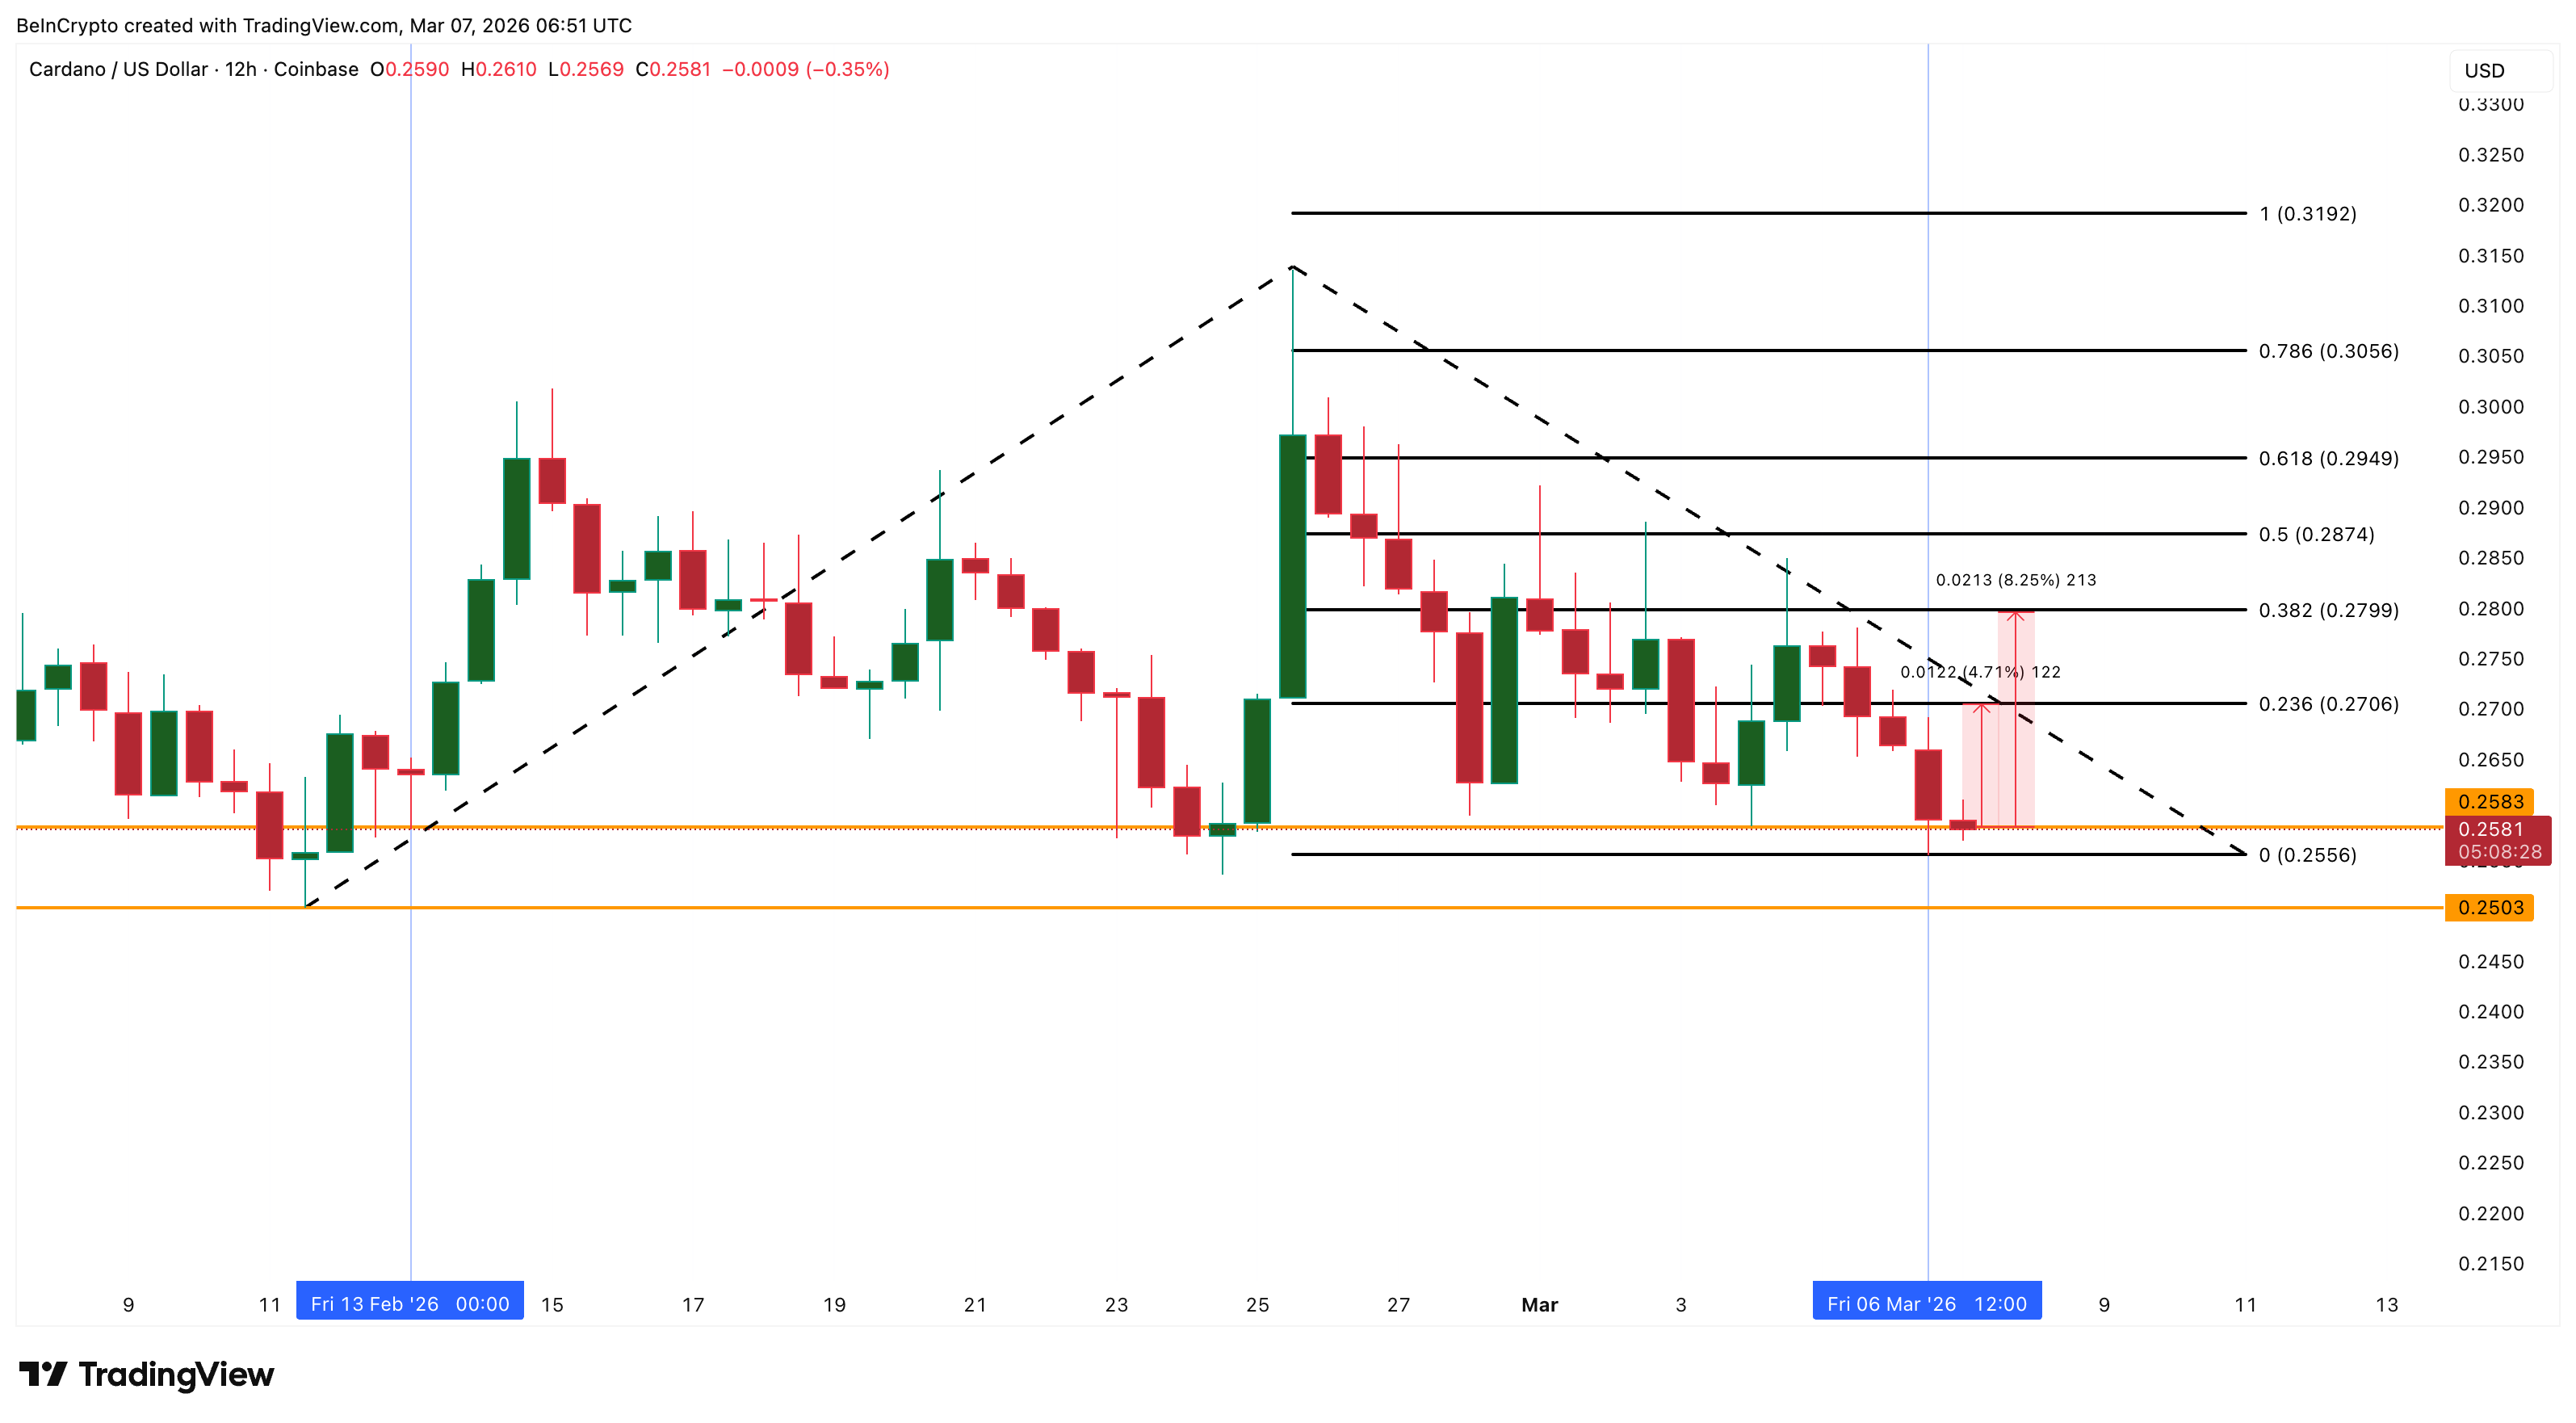
From a technical perspective, trend-based Fibonacci extension levels drawn from the February 11 rally to the February 25 peak and the March 6 pullback highlight several key zones. ADA is currently trading around $0.258, just above the $0.255 support level.
If buyers defend this level, the next rebound target sits near $0.270, representing roughly 5% upside from current prices. This level has repeatedly acted as resistance throughout early March.
A move above $0.270 could push the ADA price toward $0.279, a level that has rejected several recent rallies.
Stronger bullish momentum would only emerge if Cardano manages to reclaim the $0.287–$0.294 range, where previous recoveries stalled.
 Cardano Price Analysis: TradingView
However, the rebound scenario would weaken if the ADA price falls below $0.255. A breakdown there could push the price toward $0.250, invalidating the short-term bounce setup.
For now, the combination of a bullish divergence, a profitability bottom, and a 50% drop in selling pressure suggests Cardano may attempt a weekend rebound. However, the move could remain weak unless buyers push the price above nearby resistance levels.
Recommended Articles


