


Dow Jones slides as Nvidia, AMD tumble on chip tariffs; Powell speech eyed
- Nvidia and AMD plunge over 6% after the US imposes export license restrictions; losses could exceed $6.3 billion combined.
- US launches rare minerals investigation, pressures global allies to block Chinese shipments.
- Strong retail sales offset by weak industrial output; Fed cut odds remain low ahead of Powell’s 17:30 GMT speech.
The Dow Jones Industrial Average (DJIA) registers minuscule losses in the mid-North American session as semiconductor-linked companies like Nvidia and AMD got hit by tariffs imposed by United States (US) President Donald Trump. The DJIA is down 0.46% above 40,100 for the second consecutive day.
DJIA down 0.46% as US export curbs to China hit semiconductor stocks; risk sentiment weakens amid rare minerals probe
US equities tread water, particularly chipmakers Nvidia and AMD, as the US Government issued new export licensing requirements to send chips from the US to China. Hence, Nvidia and AMD plunged over 6% respectively. Reuters revealed that these measures will hit both companies.
“Nvidia said it faces $5.5 billion in charges after the restrictions, while AMD said it expects an $800 million hit,” according to Reuters.
Risk appetite turned sour as the US launched a rare minerals investigation after China announced export controls. The US is trying to isolate China, asking more than 70 countries to disallow China from shipping goods through their countries.
On the data front, US Retail Sales exceeded estimates, while Industrial Production shrank by 0.3% MoM, more than the 0.2% expected by analysts, as revealed by the US Federal Reserve (Fed).
The data didn’t move the needle regarding market pricing rate cuts by the Fed. According to CME's FedWatch Tool, traders see an 18% chance the Fed will ease rates by 25 basis points at its May meeting.
Ahead, traders are eyeing Fed Chair Jerome Powell's speech at 17:30 GMT, looking for cues about the path of interest rates.
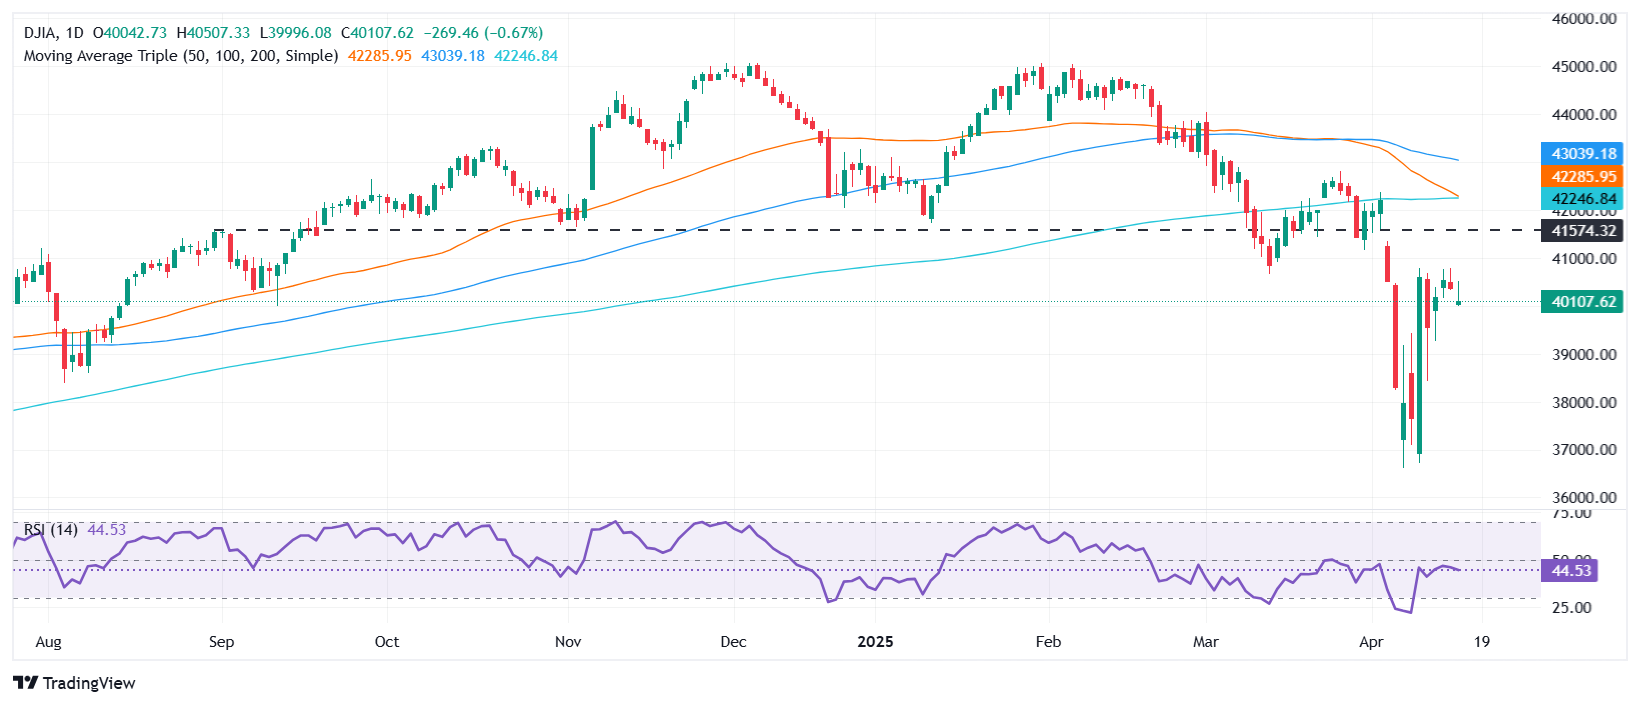
Dow Jones price forecast
The Dow Jones is downward biased, though bulls have remained able to hold to gains above 40,100. Nevertheless, momentum seems to be favoring bears, which, if they push the DJIA below the latter, would exacerbate a drop to challenge the April 14 low of 39,877, ahead of the April 7 swing low of 36,480. On the other hand, a break above 40,500 opens the path to test the April 1 high at 40,909 and 41,000.
Dow Jones FAQs
The Dow Jones Industrial Average, one of the oldest stock market indices in the world, is compiled of the 30 most traded stocks in the US. The index is price-weighted rather than weighted by capitalization. It is calculated by summing the prices of the constituent stocks and dividing them by a factor, currently 0.152. The index was founded by Charles Dow, who also founded the Wall Street Journal. In later years it has been criticized for not being broadly representative enough because it only tracks 30 conglomerates, unlike broader indices such as the S&P 500.
Many different factors drive the Dow Jones Industrial Average (DJIA). The aggregate performance of the component companies revealed in quarterly company earnings reports is the main one. US and global macroeconomic data also contributes as it impacts on investor sentiment. The level of interest rates, set by the Federal Reserve (Fed), also influences the DJIA as it affects the cost of credit, on which many corporations are heavily reliant. Therefore, inflation can be a major driver as well as other metrics which impact the Fed decisions.
Dow Theory is a method for identifying the primary trend of the stock market developed by Charles Dow. A key step is to compare the direction of the Dow Jones Industrial Average (DJIA) and the Dow Jones Transportation Average (DJTA) and only follow trends where both are moving in the same direction. Volume is a confirmatory criteria. The theory uses elements of peak and trough analysis. Dow’s theory posits three trend phases: accumulation, when smart money starts buying or selling; public participation, when the wider public joins in; and distribution, when the smart money exits.
There are a number of ways to trade the DJIA. One is to use ETFs which allow investors to trade the DJIA as a single security, rather than having to buy shares in all 30 constituent companies. A leading example is the SPDR Dow Jones Industrial Average ETF (DIA). DJIA futures contracts enable traders to speculate on the future value of the index and Options provide the right, but not the obligation, to buy or sell the index at a predetermined price in the future. Mutual funds enable investors to buy a share of a diversified portfolio of DJIA stocks thus providing exposure to the overall index.
Recommended Articles


