

US Dollar steadies as markets look for fresh clues in the US PCE inflation release
- Markets are chasing safe havens such as Gold to fresh all-time highs.
- Traders brace for the February US PCE release, looking for fresh clues on inflation.
- The US Dollar Index trades stable around 104.50, though no safe-haven flow in the Greenback.
The US Dollar Index (DXY), which tracks the performance of the US Dollar (USD) against six major currencies, is currently flat to slightly higher near 104.50 at the time of writing on Friday. Traders are not really looking at the Greenback but rather at an exodus from Equities and Cryptocurrencies into the precious metals’ market, where Gold has hit another all-time high this Friday at $3,086. The reciprocal tariff deadline is approaching fast, April 2, and clearly has struck a nerve amongst traders and market participants.
On the economic data front, all eyes are on the Federal Reserve (Fed) preferred inflation gauge, the US Personal Consumption Expenditures (PCE) data for February. The core and headline monthly PCE readings are both expected to grow steadily by 0.3%.
Daily digest market movers: All eyes in PCE for fresh clues on inflation
- At 12:30 GMT, the US Personal Consumption Expenditures data for February is due to be released:
- The monthly headline PCE is set to come in at 0.3%, unchanged from the previous 0.3%. The yearly gauge is expected to remain stable at 2.5%.
- The monthly core PCE should grow steadily by 0.3%. The yearly core PCE should tick up to 2.7% from 2.6%.
- At the same time, the US Personal Income month-on-month for February is expected to ease to 0.4% from 0.9% previously. The US Personal Spending for February should tick up to 0.5%, coming from the previous contraction of 0.2%.
- At 14:00 GMT, the University of Michigan Consumer Sentiment Index reading for March is expected to remain stable at 57.9. The 5-year Consumer Inflation Expectations are set to remain unchanged at 3.9%.
- At 16:15 GMT, Federal Reserve Bank Vice Chair for Supervision Michael Barr will speak on Banking Policy at the 2025 Banking Institute in Charlotte, N.C.
- At 19:30 GMT, Federal Reserve Bank of Atlanta President Raphael Bostic will moderate a policy panel at the third annual Georgia Tech-Atlanta Fed Household Finance Conference at the Atlanta Fed, Atlanta, Georgia.
- Equities are diving lower with losses between 0.5% to 2% crossing from Asia over Europe and into US futures.
- According to the CME Fedwatch Tool, the probability of interest rates remaining at the current range of 4.25%-4.50% in May’s meeting is 87.1%. For June’s meeting, the odds for borrowing costs being lower stand at 65.5%.
- The US 10-year yield trades around 4.33%, looking for direction with some small safe haven inflow.
US Dollar Index Technical Analysis: What about inflation?
The US Dollar Index (DXY) has been roughly consolidating since that seismic drop at the start of March. Slowly but surely, some small unwinding of that big move lower is starting to unfold. Look for a synchronized move, with Gold paring back gains and the rate differential between the US and other countries widening again, for a comeback of the DXY to 105.00/106.00.
With the weekly close above 104.00 last week, a return to the 105.00 round level could still occur in the coming days, with the 200-day Simple Moving Average (SMA) converging at that point and reinforcing this area as a strong resistance at 104.95. Once broken through that zone, a string of pivotal levels, such as 105.53 and 105.89, could limit the upward momentum.
On the downside, the 104.00 round level is the first nearby support after a successful bounce on Tuesday. If that level does not hold, the DXY risks falling back into that March range between 104.00 and 103.00. Once the lower end at 103.00 gives way, watch out for 101.90 on the downside.
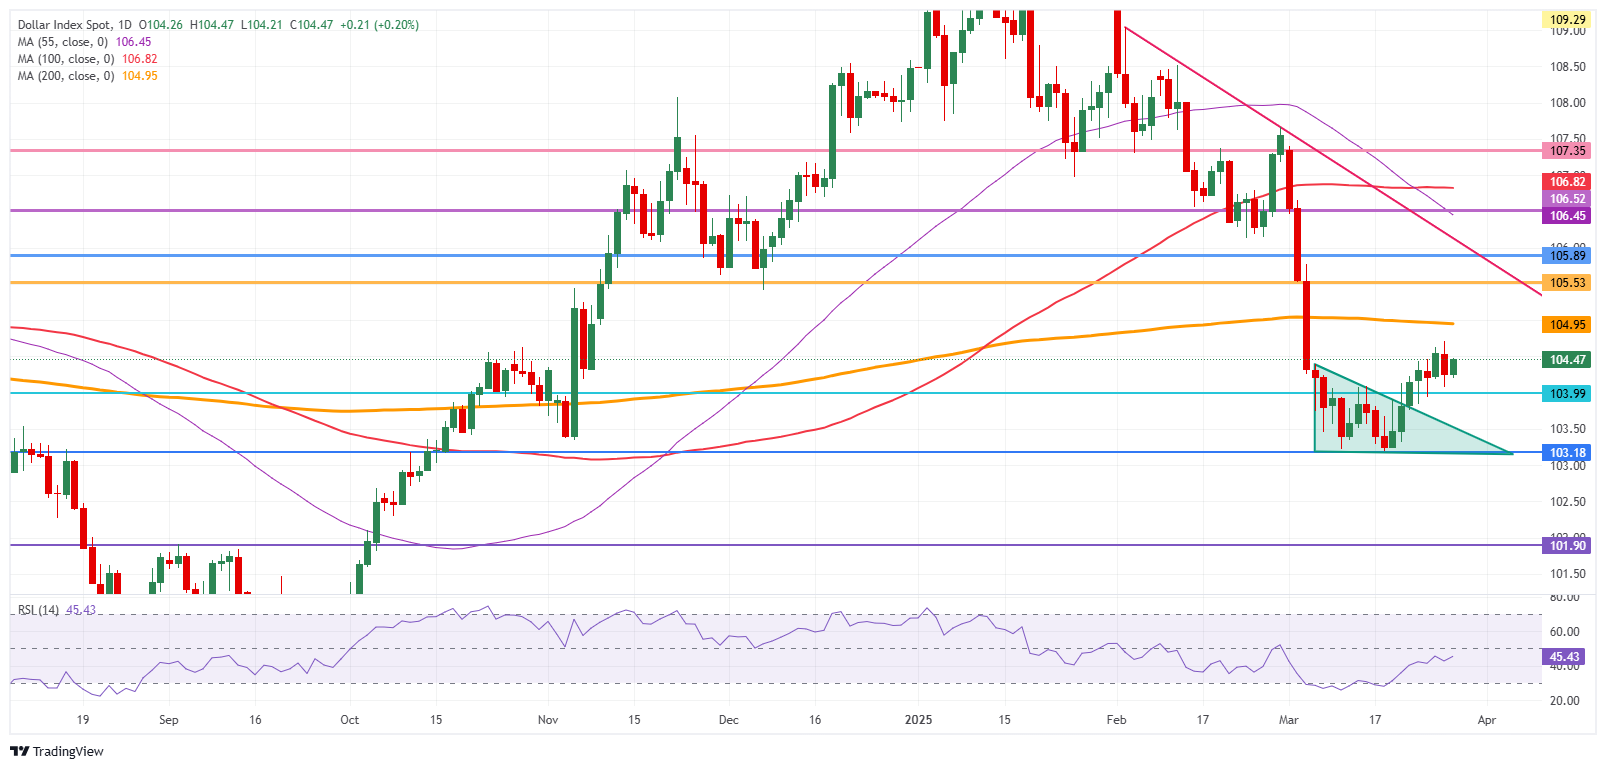
US Dollar Index: Daily Chart
US-China Trade War FAQs
Generally speaking, a trade war is an economic conflict between two or more countries due to extreme protectionism on one end. It implies the creation of trade barriers, such as tariffs, which result in counter-barriers, escalating import costs, and hence the cost of living.
An economic conflict between the United States (US) and China began early in 2018, when President Donald Trump set trade barriers on China, claiming unfair commercial practices and intellectual property theft from the Asian giant. China took retaliatory action, imposing tariffs on multiple US goods, such as automobiles and soybeans. Tensions escalated until the two countries signed the US-China Phase One trade deal in January 2020. The agreement required structural reforms and other changes to China’s economic and trade regime and pretended to restore stability and trust between the two nations. However, the Coronavirus pandemic took the focus out of the conflict. Yet, it is worth mentioning that President Joe Biden, who took office after Trump, kept tariffs in place and even added some additional levies.
The return of Donald Trump to the White House as the 47th US President has sparked a fresh wave of tensions between the two countries. During the 2024 election campaign, Trump pledged to impose 60% tariffs on China once he returned to office, which he did on January 20, 2025. With Trump back, the US-China trade war is meant to resume where it was left, with tit-for-tat policies affecting the global economic landscape amid disruptions in global supply chains, resulting in a reduction in spending, particularly investment, and directly feeding into the Consumer Price Index inflation.
Recommended Articles


