


US Dollar faces worst weekly performance in over a year
- DXY plunges further, losing over 3.5% this week.
- February's Nonfarm Payrolls miss expectations and the unemployment rate rises.
- Fed officials signal multiple rate cuts in 2025, fueling more USD weakness.
- Tariff uncertainty continues as President Trump hints at new Canada levies.
The US Dollar Index (DXY) extends its brutal slide on Friday, heading for its worst weekly performance in over a year as traders accelerate the selloff ahead of the February employment report. The Greenback is now in freefall, with expectations of multiple Fed rate cuts and growing economic uncertainty driving capital outflows.
Meanwhile, tariff-related volatility continues, with United States (US) President Donald Trump keeping markets on edge by hinting at fresh trade measures against Canada but refusing to commit to a timeline. DXY is now struggling to hold the 104.00 handle, having lost over 3.5% since Monday, marking a historic devaluation.
Daily digest market movers: USD spirals lower amid Fed and tariff risks, February’s NFP reading
- On the data front, US Nonfarm Payrolls (NFP) for February came in at 151,000, missing the 160,000 forecast but above January’s 125,000 print.
- Average Hourly Earnings growth slowed to 0.3% month-over-month, a drop from January’s 0.4%.
- The US unemployment rate climbed to 4.1%, marking an uptick from the previous 4.0%.
- Fed Governor Christopher Waller suggested the potential for up to three rate cuts this year, reinforcing the market’s dovish expectations.
- Federal Reserve Chair Jerome Powell warned that ongoing policy uncertainty complicates the central bank’s ability to adjust monetary policy.
- Markets continue digesting shifting Fed policy expectations, with the interest rate differential between the US and other economies narrowing.
- President Trump hinted at fresh tariffs on Canada but refrained from confirming a specific timeline, leaving uncertainty hanging over markets.
- CME FedWatch Tool now shows a rising probability of a June rate cut, as traders further price in easing.
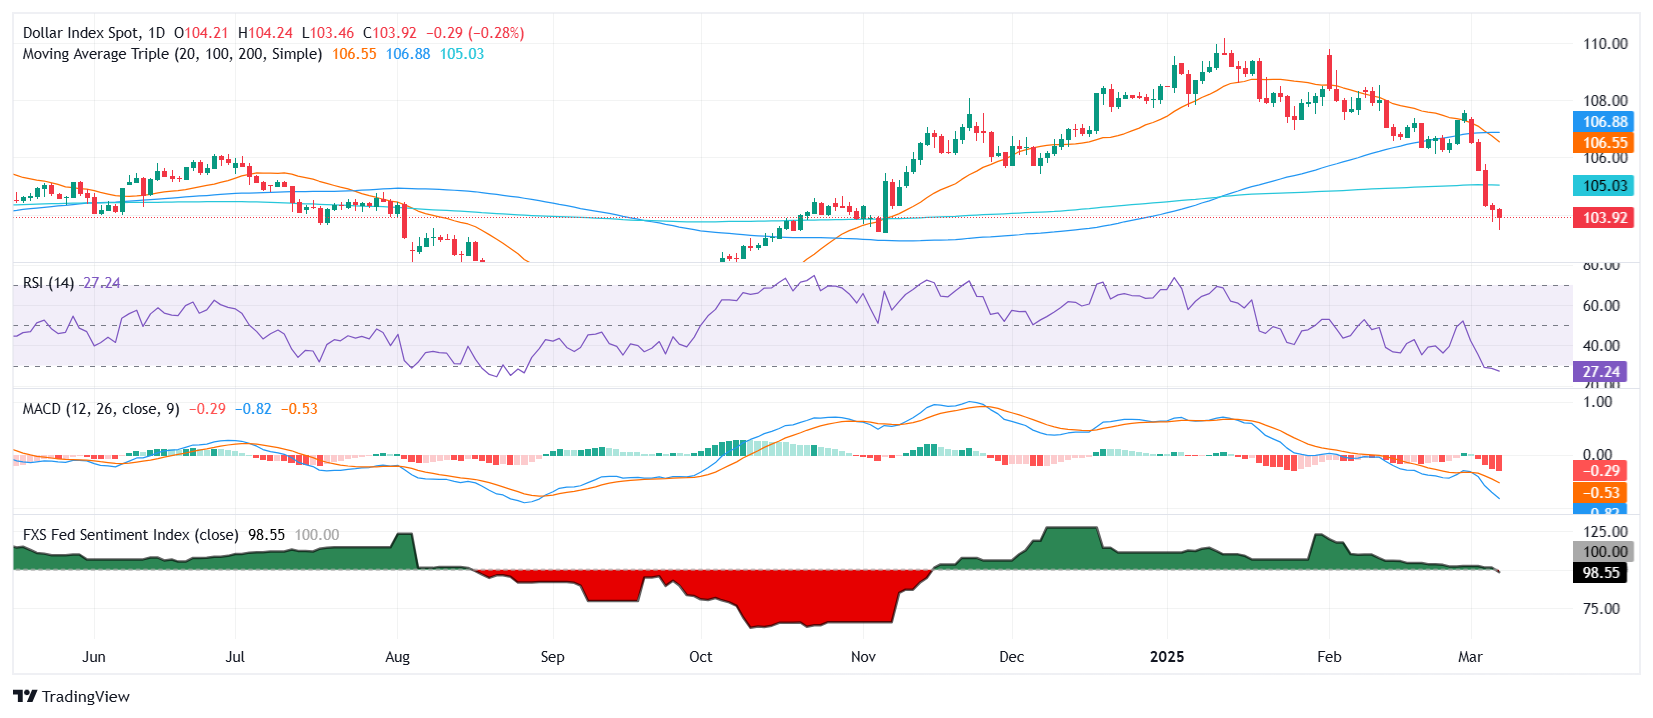
- On the daily chart, the Fed sentiment index fell towards 100, which reflects a slow lean of the Fed towards a more dovish stance.
DXY technical outlook: Bearish pressure dominates
The US Dollar Index (DXY) is entrenched in a deep selloff, having broken below 104.00 and revisiting its lowest levels since November 2024. The 20-day and 100-day Simple Moving Averages (SMA) have now confirmed a bearish crossover, reinforcing negative momentum. The Relative Strength Index (RSI) signals oversold conditions, suggesting a potential short-term rebound, but the MACD remains firmly in bearish territory, pointing to continued downside risk. Should DXY fail to reclaim 104.50, the next key support level lies at 103.50, which could determine whether the selloff extends further.
Nonfarm Payrolls FAQs
Nonfarm Payrolls (NFP) are part of the US Bureau of Labor Statistics monthly jobs report. The Nonfarm Payrolls component specifically measures the change in the number of people employed in the US during the previous month, excluding the farming industry.
The Nonfarm Payrolls figure can influence the decisions of the Federal Reserve by providing a measure of how successfully the Fed is meeting its mandate of fostering full employment and 2% inflation. A relatively high NFP figure means more people are in employment, earning more money and therefore probably spending more. A relatively low Nonfarm Payrolls’ result, on the either hand, could mean people are struggling to find work. The Fed will typically raise interest rates to combat high inflation triggered by low unemployment, and lower them to stimulate a stagnant labor market.
Nonfarm Payrolls generally have a positive correlation with the US Dollar. This means when payrolls’ figures come out higher-than-expected the USD tends to rally and vice versa when they are lower. NFPs influence the US Dollar by virtue of their impact on inflation, monetary policy expectations and interest rates. A higher NFP usually means the Federal Reserve will be more tight in its monetary policy, supporting the USD.
Nonfarm Payrolls are generally negatively-correlated with the price of Gold. This means a higher-than-expected payrolls’ figure will have a depressing effect on the Gold price and vice versa. Higher NFP generally has a positive effect on the value of the USD, and like most major commodities Gold is priced in US Dollars. If the USD gains in value, therefore, it requires less Dollars to buy an ounce of Gold. Also, higher interest rates (typically helped higher NFPs) also lessen the attractiveness of Gold as an investment compared to staying in cash, where the money will at least earn interest.
Nonfarm Payrolls is only one component within a bigger jobs report and it can be overshadowed by the other components. At times, when NFP come out higher-than-forecast, but the Average Weekly Earnings is lower than expected, the market has ignored the potentially inflationary effect of the headline result and interpreted the fall in earnings as deflationary. The Participation Rate and the Average Weekly Hours components can also influence the market reaction, but only in seldom events like the “Great Resignation” or the Global Financial Crisis.
Recommended Articles


