

US Dollar consolidates with US markets closed for President’s Day
- The US Dollar consolidates ahead of a very important week in geopolitics.
- Traders brace for headlines that could emerge from Riyadh on a possible breakthrough.
- The US Dollar Index (DXY) resides and looks for a direction in the mid-106 region.
The US Dollar Index (DXY), which tracks the performance of the US Dollar (USD) against six major currencies, consolidates last week’s losses and trades flat at around 106.80 at the time of writing on Monday. The United States (US) economy is no longer an outlier, with several data points and the blood-red January Retail Sales data released last week pointing to slower economic growth. All eyes this week will be on Riyadh, in Saudi Arabia, where US and Russian officials are set to meet ahead of a meeting between US President Donald Trump and Russian President Vladimir Putin.
The economic calendar is very calm this week in the run-up to the S&P Purchasing Managers Index (PMI) data on Friday. Although the US bond market is closed due to the President’s Day bank holiday, the Federal Reserve (Fed) has three policymakers lined up to speak on Monday.
Daily digest market movers: All eyes on Riyadh
- US bond markets are closed on Monday due to the President’s Day bank holidays.
- Traders will need to be vigilant for any headlines coming out of Riyadh, where US and Russian officials are meeting in the runup to the meeting between US President Donald Trump and Russian President Vladimir Putin to agree on a deal for Ukraine.
- At 14:30 GMT, Federal Reserve Bank of Philadelphia Patrick Harker delivers a speech on the economic outlook at the Central Banking Series Conference at the University of the Bahamas in Nassau.
- At 15:20 GMT, Fed Governor Michelle W. Bowman delivers brief remarks on the economy and bank regulation at the American Bankers Association (ABA) Conference for Community Bankers in Phoenix, Arizona.
- Closing off this Monday, at 23:00 GMT, Fed Governor Christopher J. Waller speaks on the economic outlook at the UNSW Macroeconomic Workshop in Sydney, Australia.
- Equities start off this week with some small and cautious gains.
- The CME FedWatch tool shows a 46.7% chance that interest rates will remain unchanged at current levels in June.
- The US 10-year yield is trading around 4.48%, and will remain closed for trading this Monday
US Dollar Index Technical Analysis: There it goes
The US Dollar Index (DXY) is not expected to go anywhere this Monday with most US markets closed due to President’s Day. The main focus will be on headlines around Ukraine, where the question will be what kind of deal will be put on the table. Be on the lookout thus for false breaks on a peace deal being reached, with the aftermath resulting in a knee jerk reaction and seeing the DXY possibly rally from there on out.
On the upside, the previous support at 107.35 has now turned into a firm resistance. Further up, the 55-day SMA at 107.91 must be regained before reclaiming 108.00.
On the downside, look for 106.52 (April 16, 2024, high), 106.40 (100-day SMA), or even 105.89 (resistance in June 2024) as support levels. As the Relative Strength Index (RSI) momentum indicator in the daily chart shows room for more downside, the 200-day SMA at 104.93 could be a possible outcome.
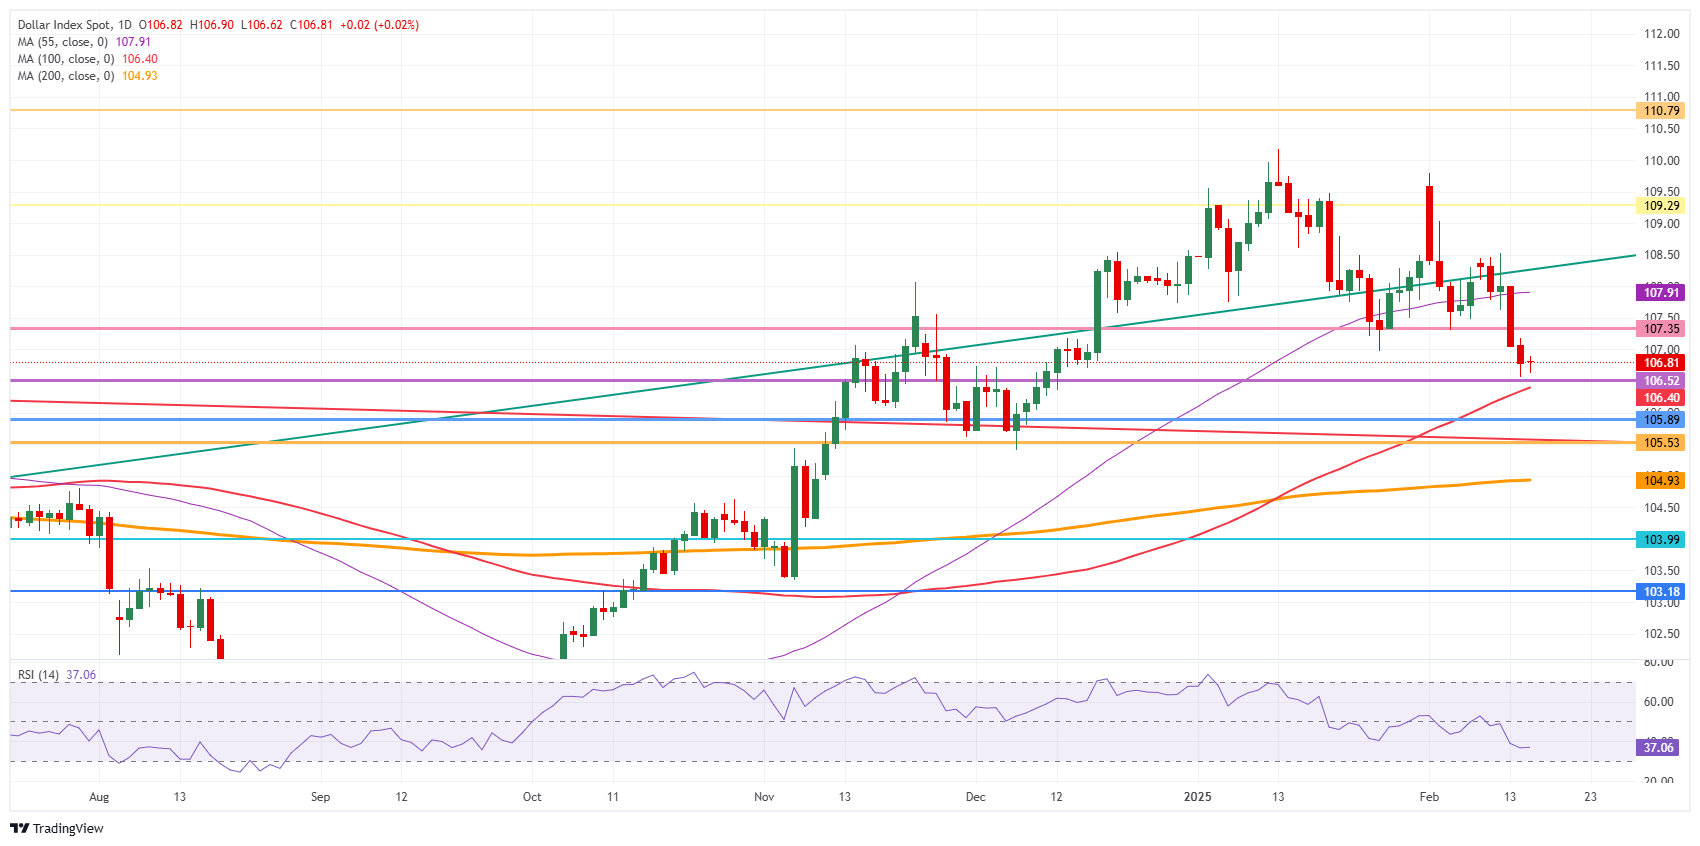
US Dollar Index: Daily Chart
US Dollar FAQs
The US Dollar (USD) is the official currency of the United States of America, and the ‘de facto’ currency of a significant number of other countries where it is found in circulation alongside local notes. It is the most heavily traded currency in the world, accounting for over 88% of all global foreign exchange turnover, or an average of $6.6 trillion in transactions per day, according to data from 2022. Following the second world war, the USD took over from the British Pound as the world’s reserve currency. For most of its history, the US Dollar was backed by Gold, until the Bretton Woods Agreement in 1971 when the Gold Standard went away.
The most important single factor impacting on the value of the US Dollar is monetary policy, which is shaped by the Federal Reserve (Fed). The Fed has two mandates: to achieve price stability (control inflation) and foster full employment. Its primary tool to achieve these two goals is by adjusting interest rates. When prices are rising too quickly and inflation is above the Fed’s 2% target, the Fed will raise rates, which helps the USD value. When inflation falls below 2% or the Unemployment Rate is too high, the Fed may lower interest rates, which weighs on the Greenback.
In extreme situations, the Federal Reserve can also print more Dollars and enact quantitative easing (QE). QE is the process by which the Fed substantially increases the flow of credit in a stuck financial system. It is a non-standard policy measure used when credit has dried up because banks will not lend to each other (out of the fear of counterparty default). It is a last resort when simply lowering interest rates is unlikely to achieve the necessary result. It was the Fed’s weapon of choice to combat the credit crunch that occurred during the Great Financial Crisis in 2008. It involves the Fed printing more Dollars and using them to buy US government bonds predominantly from financial institutions. QE usually leads to a weaker US Dollar.
Quantitative tightening (QT) is the reverse process whereby the Federal Reserve stops buying bonds from financial institutions and does not reinvest the principal from the bonds it holds maturing in new purchases. It is usually positive for the US Dollar.
Recommended Articles


