


Dow Jones Industrial Average surges on soft US NFP data, Fed easing hopes rise
- Dow climbs 0.71%, rebounding as softer data fuels rate-cut speculation.
- S&P 500 and Nasdaq follow, both gaining over 0.6% amid broad optimism.
- Amazon shines with 6.5% rise; Apple lags with 1.5% drop on weak China sales.
The Dow Jones Industrial Average (DJIA) posted solid gains of close to almost 300 points or 0.71% on Friday, on softer-than-expected economic data, reinforcing investors' hypothesis of further easing by the Federal Reserve. Wall Street made a U-turn following Thursday’s losses and rallied sharply ahead of the weekend.
Data revealed by the US Bureau of Labor Statistics (BLS) showed that strong hurricanes and union strikes distorted Nonfarm Payrolls in October. The US economy created 12K jobs, below the 113K estimated. Despite this, the unemployment rate remained at 4.1%, as traders braced for other data.
The Institute for Supply Management (ISM) recently revealed that manufacturing activity fell for the seventh consecutive month, hitting its lowest level since July 2023. The ISM Manufacturing PMI dipped from 47.2 to 46.5, missing forecasts of 47.6.
Meanwhile, Wall Street posted solid gains, with the S&P 500 following the Dow Jones’ upward path, gaining over 0.63% to 5741.45, while the Nasdaq climbed 0.75% up to 18,230.29.
Next week, the US economic docket will be busy with the US Presidential Elections on November 5. Traders will also be eyeing the Federal Reserve’s monetary policy on November 6-7 and will scrutinize Fed Chair Jerome Powell's speech.The CME FedWatch Tool shows odds for a 25 bps rate cut by the Fed reaching 95%, down from 97% a day ago. This would leave rates in the 4.50%-4.75% range.
Dow Jones news
In stock news, Amazon (AMZN) is up 6.5%, bolstered by strong retail sales, which lifted its profits above estimates. Apple (APPL) was hit by a drop in sales in China and fell 1.5%, while Chevron (CVX) exceeded estimates on profits per share, production, and sales. Meanwhile, Boeing (BA) shareholders were relieved as the stock climbed 3%, and the ongoing strike is nearing an end.
The stocks leading the pack in Dow Jones are Intel (INTC), up 6.92% at $23.01 a share, closely followed by Amazon, up 6.02% at $197.62, and Boeing, up 2.99% at $153.77. The laggards are Apple shares, down 1.63% at $222.22; Verizon (VZ), losing 1.51% at $41.50; and the Dow (DOW), with its share price at $48.87, losing 1.03%.
Dow Jones price forecast
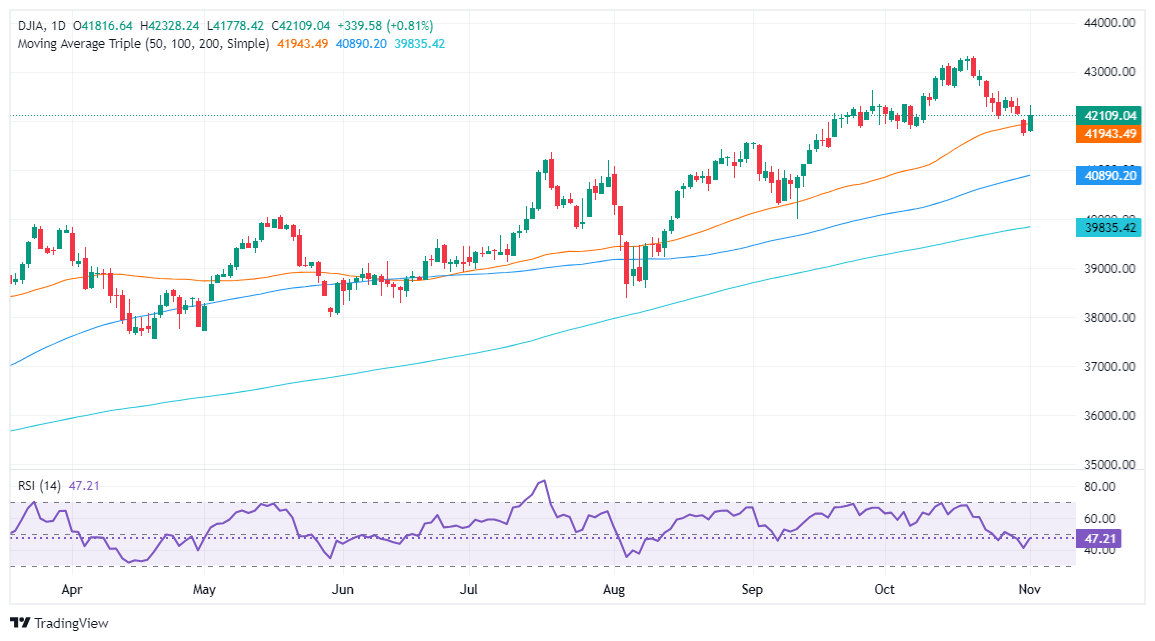
The Dow Jones Industrial Average has risen above 42,000 after hitting a weekly low of 41,692 below the 50-day Simple Moving Average (SMA) at 41,943. Initially, this increased the chances to challenge the September 2 high turned support at 41,564 ahead of the 41,000 area. However, buyers emerged and lifted the US equity index higher ahead of next week’s US Presidential Elections.
If the Dow Jones posts a daily close above 42,000 buyers, it could remain hopeful of challenging the October 30 low, which turned resistance at 42,122. Once cleared, the next stop would be October 31, high 42,460. On further strength, 42,500 could be reached before testing 43,000.
Momentum is bearish, with the Relative Strength Index (RSI) remaining below its neutral line. But, in the short-term, a small spike threatening to cross the neutral line hints that buyers are gathering steam.
Dow Jones daily chart
Dow Jones FAQs
The Dow Jones Industrial Average, one of the oldest stock market indices in the world, is compiled of the 30 most traded stocks in the US. The index is price-weighted rather than weighted by capitalization. It is calculated by summing the prices of the constituent stocks and dividing them by a factor, currently 0.152. The index was founded by Charles Dow, who also founded the Wall Street Journal. In later years it has been criticized for not being broadly representative enough because it only tracks 30 conglomerates, unlike broader indices such as the S&P 500.
Many different factors drive the Dow Jones Industrial Average (DJIA). The aggregate performance of the component companies revealed in quarterly company earnings reports is the main one. US and global macroeconomic data also contributes as it impacts on investor sentiment. The level of interest rates, set by the Federal Reserve (Fed), also influences the DJIA as it affects the cost of credit, on which many corporations are heavily reliant. Therefore, inflation can be a major driver as well as other metrics which impact the Fed decisions.
Dow Theory is a method for identifying the primary trend of the stock market developed by Charles Dow. A key step is to compare the direction of the Dow Jones Industrial Average (DJIA) and the Dow Jones Transportation Average (DJTA) and only follow trends where both are moving in the same direction. Volume is a confirmatory criteria. The theory uses elements of peak and trough analysis. Dow’s theory posits three trend phases: accumulation, when smart money starts buying or selling; public participation, when the wider public joins in; and distribution, when the smart money exits.
There are a number of ways to trade the DJIA. One is to use ETFs which allow investors to trade the DJIA as a single security, rather than having to buy shares in all 30 constituent companies. A leading example is the SPDR Dow Jones Industrial Average ETF (DIA). DJIA futures contracts enable traders to speculate on the future value of the index and Options provide the right, but not the obligation, to buy or sell the index at a predetermined price in the future. Mutual funds enable investors to buy a share of a diversified portfolio of DJIA stocks thus providing exposure to the overall index.
Recommended Articles


