

Dow Jones Industrial Average churns amid Monday whipsaw
- Dow Jones kicks off the new trading week with overcorrection in both directions.
- US data missed the mark on Monday, sparking a brief rally on rate cut hopes.
- Too-big of a dip in US data, plus a muddy election outlook, reignites recession fears.
The Dow Jones Industrial Average (DJIA) briefly rallied on Monday after a broad miss in key US data sparked a risk rally on renewed rate cut hopes. Still, the steep decline in manufacturing figures proved too much for investors to stomach. Equities gave up early gains and tumbled back into the day’s opening range.
June’s US ISM Manufacturing Purchasing Managers Index (PMI) broadly missed the mark on Monday, ticking down to 48.5 from the previous 48.7 and missing the forecast step up to 49.1. The economic indicator has spent a third consecutive month below the key 50.0 level, flashing ongoing warning signs of a broader slowdown creeping up within the US domestic economy.
ISM Manufacturing Prices Paid also declined in June, tumbling to a six-month low of 52.1 from the previous 57.0, falling well below the forecast decline to 55.9. With inflationary pressures easing, US markets initially jumped at the outset of the new trading week as investors continue to hope for softening economic figures to push the Federal Reserve (Fed) into an accelerated pace of rate cuts. However, too-steep of a drag in US data points could easily tip the US into a recession that rate cuts won’t overcome, sparking risk-off fears and trimming Monday’s early gains.
Dow Jones news
The Dow Jones is split down the middle on Monday, with half of the index’s constituent securities in the red for the day. Merck & Co Inc. (MRK) leads the gainers, climbing 3.5% and gaining 4.3 points to trade into $128.11 per share. On the low side, Unitedhealth Group Inc. (UNH) fell back 2.66%, falling 13.78 points to $495.48 per share.
Dow Jones technical outlook
Sideways churn is the name of the game for the Dow Jones as the major equity index grinds out a rough near-term lateral channel. The DJIA is cycling just above the 39,000.00 handle as bidders refuse to let the Dow decline but lack the necessary momentum to reclaim higher chart territory.
Daily candles continue to churn out a growing consolidation pattern as the Dow Jones gets strung along the 50-day Exponential Moving Average (EMA) at 38,908.22. The DJIA continues to hold on the high side of late May’s bottom near 38,000.00, but topside momentum remains unable to recover ground back to all-time highs set just north of the 40,000.00 major price handle in May.
Dow Jones five minute chart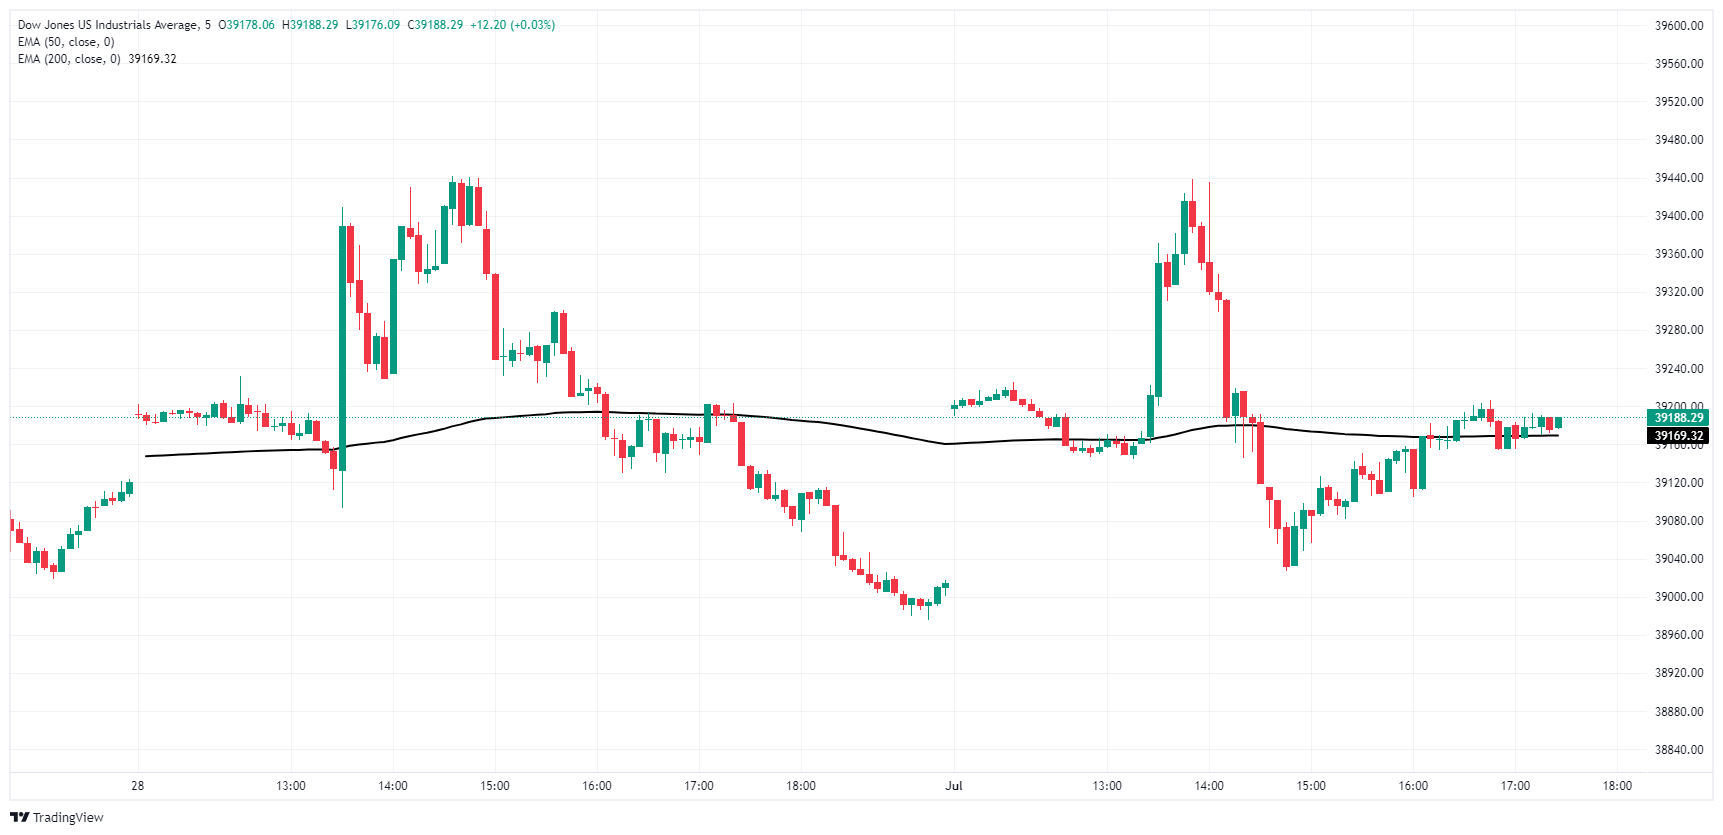
Dow Jones daily chart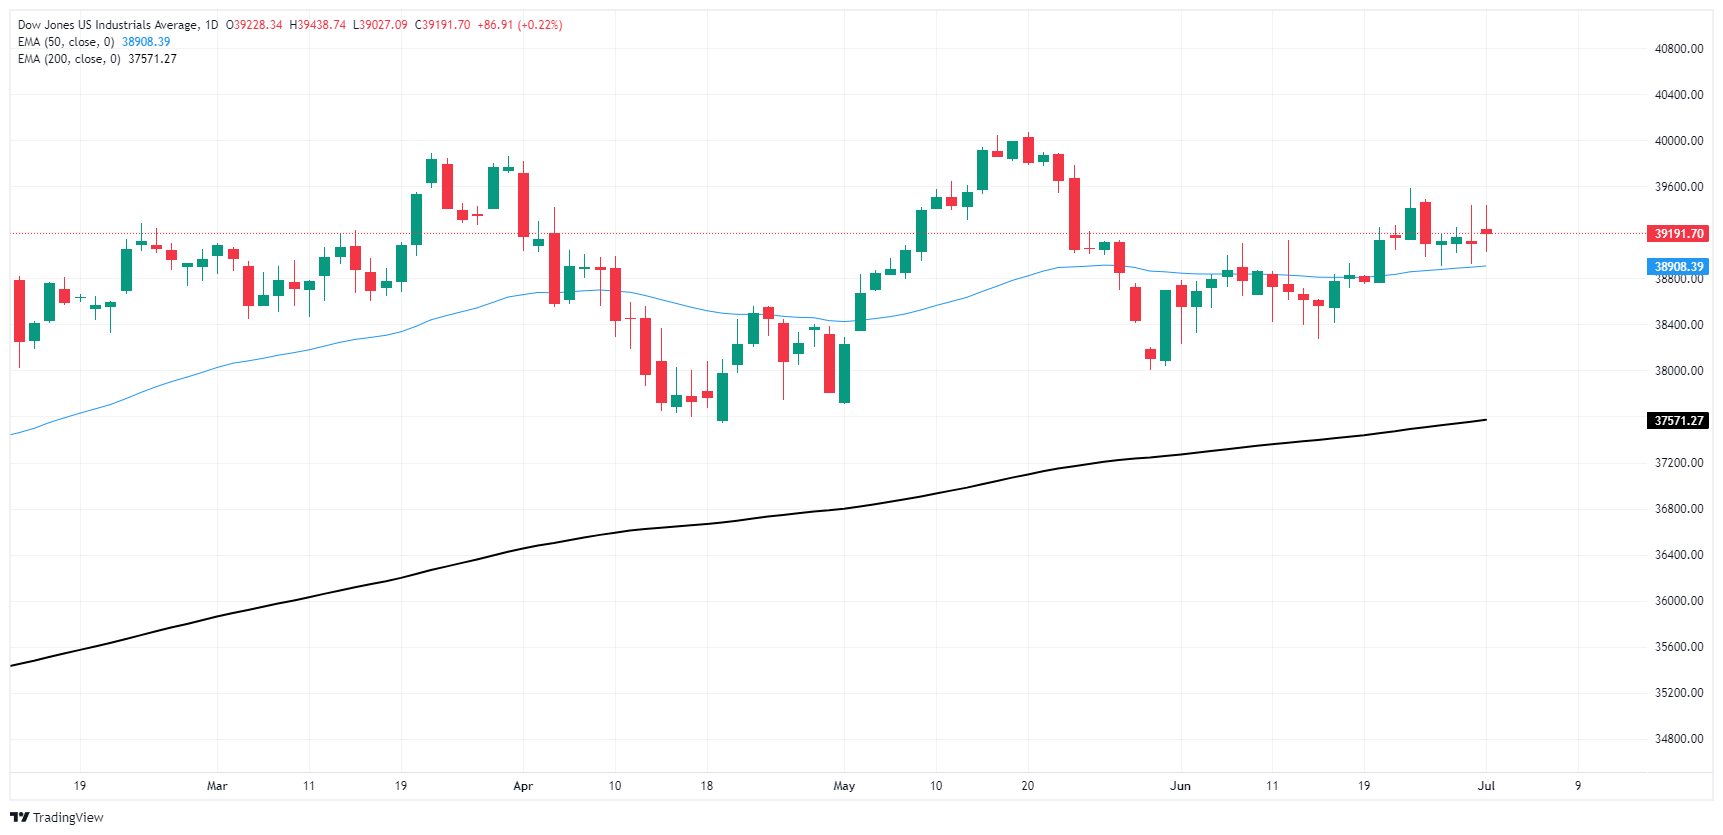
Dow Jones FAQs
The Dow Jones Industrial Average, one of the oldest stock market indices in the world, is compiled of the 30 most traded stocks in the US. The index is price-weighted rather than weighted by capitalization. It is calculated by summing the prices of the constituent stocks and dividing them by a factor, currently 0.152. The index was founded by Charles Dow, who also founded the Wall Street Journal. In later years it has been criticized for not being broadly representative enough because it only tracks 30 conglomerates, unlike broader indices such as the S&P 500.
Many different factors drive the Dow Jones Industrial Average (DJIA). The aggregate performance of the component companies revealed in quarterly company earnings reports is the main one. US and global macroeconomic data also contributes as it impacts on investor sentiment. The level of interest rates, set by the Federal Reserve (Fed), also influences the DJIA as it affects the cost of credit, on which many corporations are heavily reliant. Therefore, inflation can be a major driver as well as other metrics which impact the Fed decisions.
Dow Theory is a method for identifying the primary trend of the stock market developed by Charles Dow. A key step is to compare the direction of the Dow Jones Industrial Average (DJIA) and the Dow Jones Transportation Average (DJTA) and only follow trends where both are moving in the same direction. Volume is a confirmatory criteria. The theory uses elements of peak and trough analysis. Dow’s theory posits three trend phases: accumulation, when smart money starts buying or selling; public participation, when the wider public joins in; and distribution, when the smart money exits.
There are a number of ways to trade the DJIA. One is to use ETFs which allow investors to trade the DJIA as a single security, rather than having to buy shares in all 30 constituent companies. A leading example is the SPDR Dow Jones Industrial Average ETF (DIA). DJIA futures contracts enable traders to speculate on the future value of the index and Options provide the right, but not the obligation, to buy or sell the index at a predetermined price in the future. Mutual funds enable investors to buy a share of a diversified portfolio of DJIA stocks thus providing exposure to the overall index.
Recommended Articles


