

Dow Jones Industrial Average tumbles almost 400 points on Wednesday
- Dow Jones extends recent declines as investors pull back.
- US equities are broadly lower in the mid-week session.
- Declining bid-to-covers on Treasuries are spiking risk aversion.
The Dow Jones Industrial Average (DJIA) is broadly lower on Wednesday, shedding nearly 400 points and backsliding into 38,500.00. The major equity index is down nearly nine-tenths of a percent as investor sentiment sours.
Demand for Treasuries appears to be declining as bid-to-cover ratios on key Treasury auctions decline, putting downward pressure on equities and bolstering the safe haven US Dollar. An auction of 7-year Treasury notes on Wednesday showed a bid-to-cover ratio of 2.43, down from the previous 2.48. The US still has no trouble auctioning off bond issuance, but decreasing covering bids implies there could be declining interest in US bonds.
Wednesday is the last day of calm before the economic calendar kicks into high gear on US data, with Gross Domestic Product (GDP) and Personal Consumption Expenditures (PCE) inflation due on Thursday and Friday, respectively.
Annualized US Q1 GDP is expected to ease to 1.3% versus the previous 1.6% on Thursday. On Friday, US PCE Price Index inflation is forecast to hold steady at 0.3% MoM. With investors desperate for signs of rate cuts from the Federal Reserve (Fed), markets will be hoping that economic activity figures and inflation data will continue to ease.
Dow Jones news
The Dow Jones backslid to its lowest bids since the beginning of the month, and is sharply lower after hitting all-time highs above 40,000.00 recently. All but five of the Dow Jones’ component securities are in the red on Wednesday, with Unitedhealth Group Inc. (UNH) tumbling over -4.4% to $481.33 per share, and declining -22.3 points. On the high side, Apple Inc. gained 0.86% to $191.62 per share after the tech company revealed their latest product line of AI-enabled smartphones.
Dow Jones technical outlook
The Dow Jones’ Wednesday declines have dragged the index below the 50-day Exponential Moving Average (EMA) at 38,895.97, and the DJIA is on pace to add another red day to the chart. The index continues to hold above the 200-day EMA at 37,232.07, but equity losses have dragged the Dow Jones down -4% from a record peak just above 40,000.00.
Dow Jones five minute chart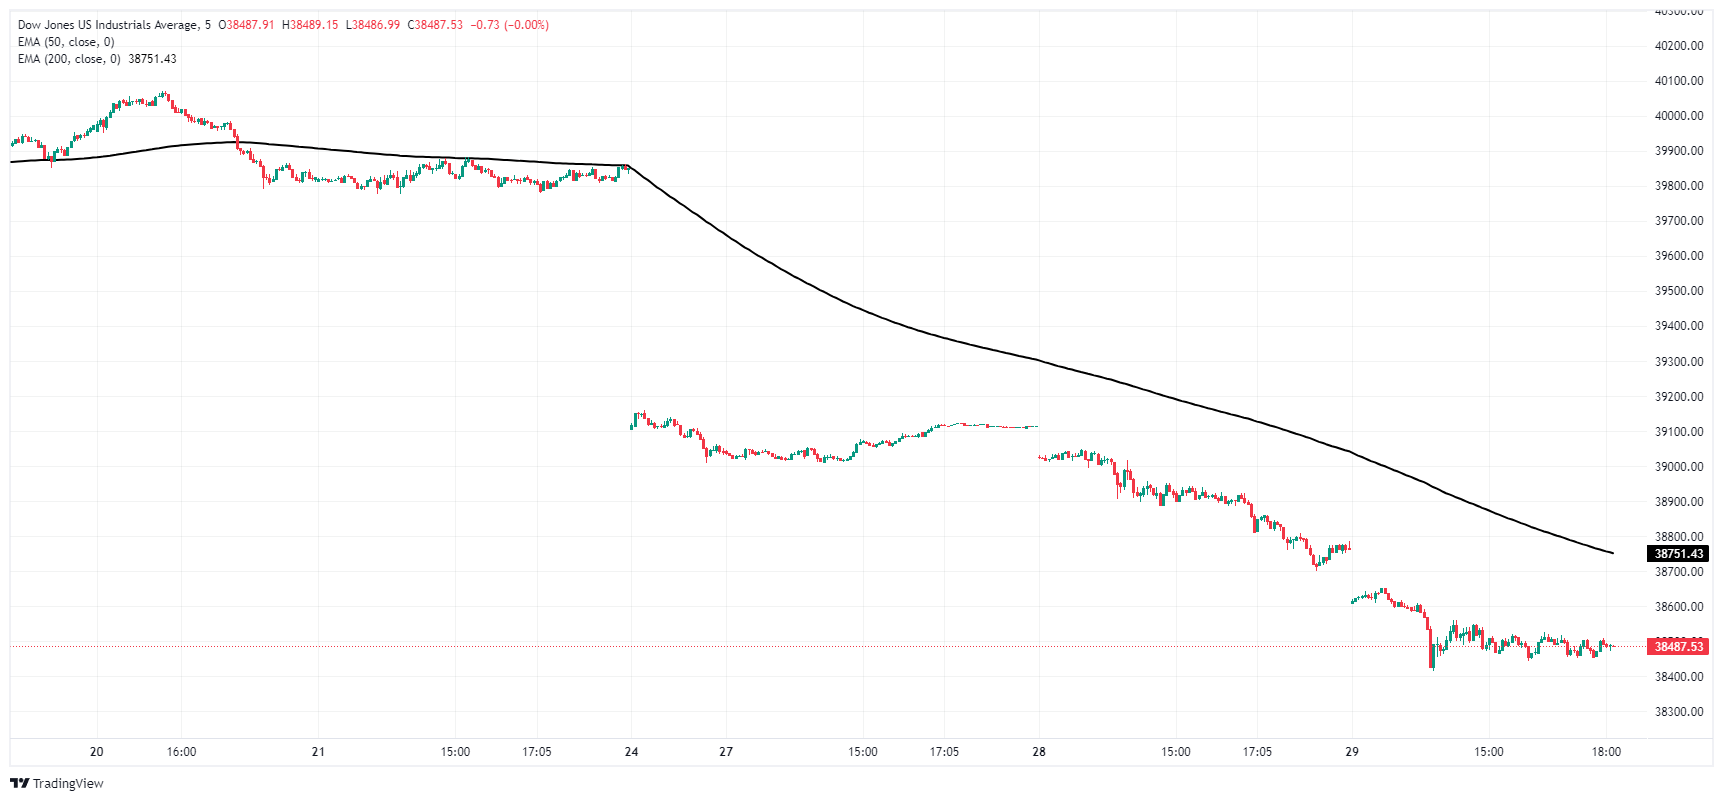
Dow Jones daily chart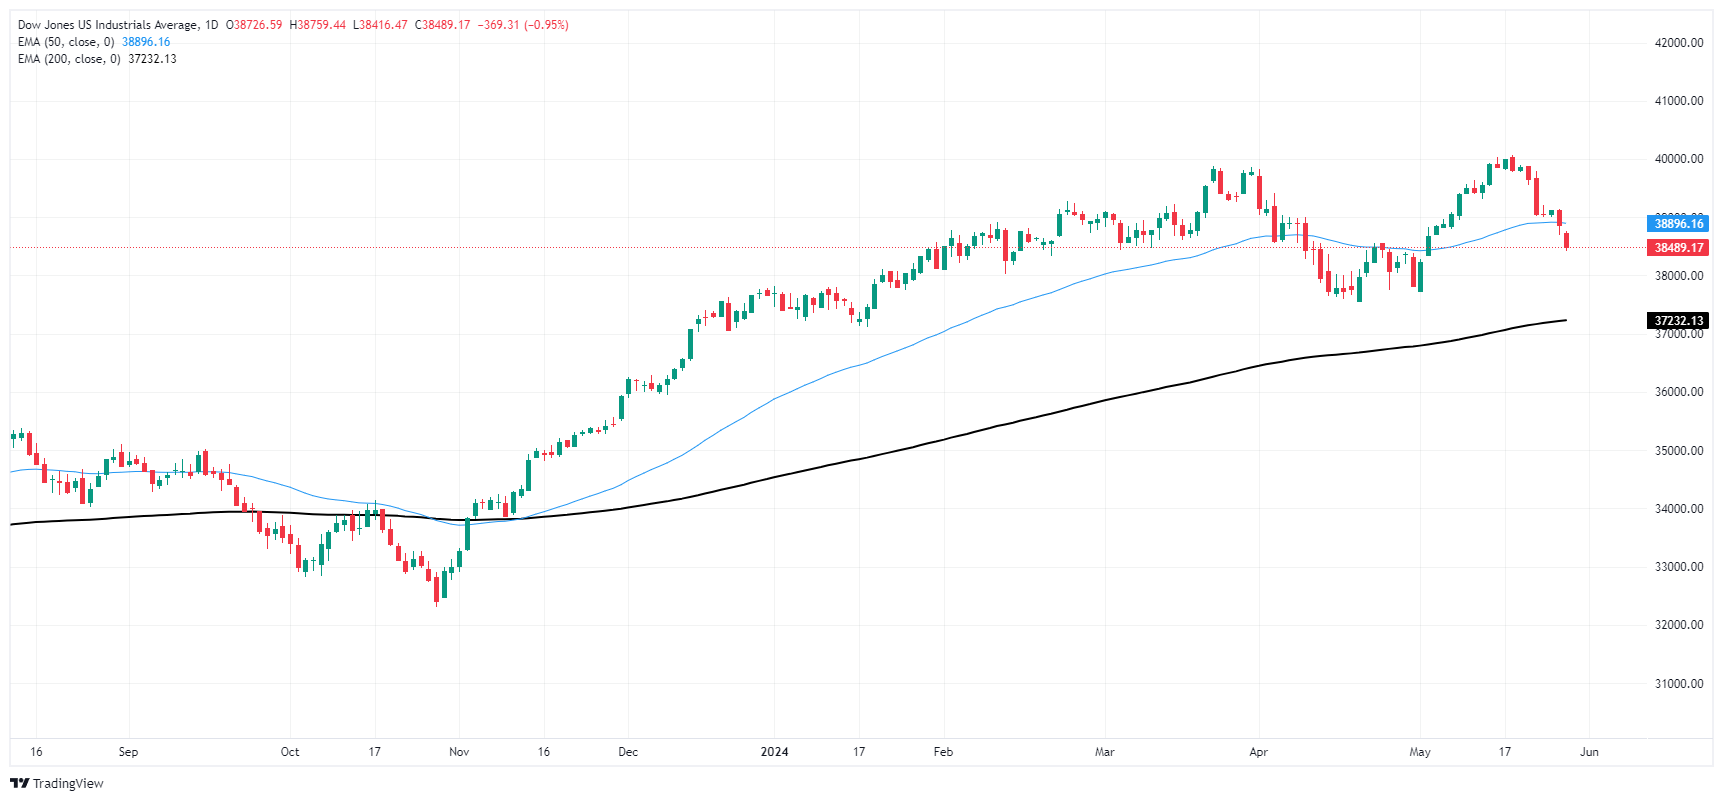
Dow Jones FAQs
The Dow Jones Industrial Average, one of the oldest stock market indices in the world, is compiled of the 30 most traded stocks in the US. The index is price-weighted rather than weighted by capitalization. It is calculated by summing the prices of the constituent stocks and dividing them by a factor, currently 0.152. The index was founded by Charles Dow, who also founded the Wall Street Journal. In later years it has been criticized for not being broadly representative enough because it only tracks 30 conglomerates, unlike broader indices such as the S&P 500.
Many different factors drive the Dow Jones Industrial Average (DJIA). The aggregate performance of the component companies revealed in quarterly company earnings reports is the main one. US and global macroeconomic data also contributes as it impacts on investor sentiment. The level of interest rates, set by the Federal Reserve (Fed), also influences the DJIA as it affects the cost of credit, on which many corporations are heavily reliant. Therefore, inflation can be a major driver as well as other metrics which impact the Fed decisions.
Dow Theory is a method for identifying the primary trend of the stock market developed by Charles Dow. A key step is to compare the direction of the Dow Jones Industrial Average (DJIA) and the Dow Jones Transportation Average (DJTA) and only follow trends where both are moving in the same direction. Volume is a confirmatory criteria. The theory uses elements of peak and trough analysis. Dow’s theory posits three trend phases: accumulation, when smart money starts buying or selling; public participation, when the wider public joins in; and distribution, when the smart money exits.
There are a number of ways to trade the DJIA. One is to use ETFs which allow investors to trade the DJIA as a single security, rather than having to buy shares in all 30 constituent companies. A leading example is the SPDR Dow Jones Industrial Average ETF (DIA). DJIA futures contracts enable traders to speculate on the future value of the index and Options provide the right, but not the obligation, to buy or sell the index at a predetermined price in the future. Mutual funds enable investors to buy a share of a diversified portfolio of DJIA stocks thus providing exposure to the overall index.
Recommended Articles


