US Dollar Index seems vulnerable near 105.00 on firm Fed rate cut bets for September

Source Fxstreet
  • The USD Index struggles to sustain above 105.00 amid signs that the US labor market cools down.
  • Firm speculation for Fed rate cuts in September keeps the US Dollar on its toes.
  • Investors shift focus to the US inflation data for fresh guidance.

The US Dollar Index (DXY) trades close to the crucial support of 105.00 in Friday’s European session. The USD Index struggles to hold the above-mentioned support as conviction among investors over the Federal Reserve (Fed) starting to reduce interest rates from the September meeting has strengthened. This has also improved the risk appetite of investors. S&P 500 futures have posted significant gains, exhibiting strong demand for risk-sensitive assets.

Cooling US labor market conditions boost Fed rate cut bets

The expectations for the Fed to begin reducing interest rates from the September meeting have escalated as a recent set of job data has indicated that labor market conditions are steadily cooling.

The United States Department of Labor reported on Thursday that individuals claiming jobless benefits for the first time were highest in the last eight months. For the week ending May 3, Initial Jobless Claims (IJC) were 231K, significantly higher than the consensus of 210K and the prior reading of 209K, upwardly revised from 208K. In addition to rising jobless claims, US employers added fewer jobs in April. Fresh Nonfarm Payrolls (NFP) were 175K, the lowest in six months.

Focus shifts to US Inflation

This week, investors relied on commentary from Fed policymakers to project US Dollar’s moves due to absence of top-tier economic data. Next week, US economic calendar will be data-packed as the Producer Price Index (PPI) and Consumer Price Index (CPI), and the Retail Sales data are lined-up for release. The major event will be the consumer price inflation data, which will influence market expectations for Fed rate cuts.

US Dollar technical analysis

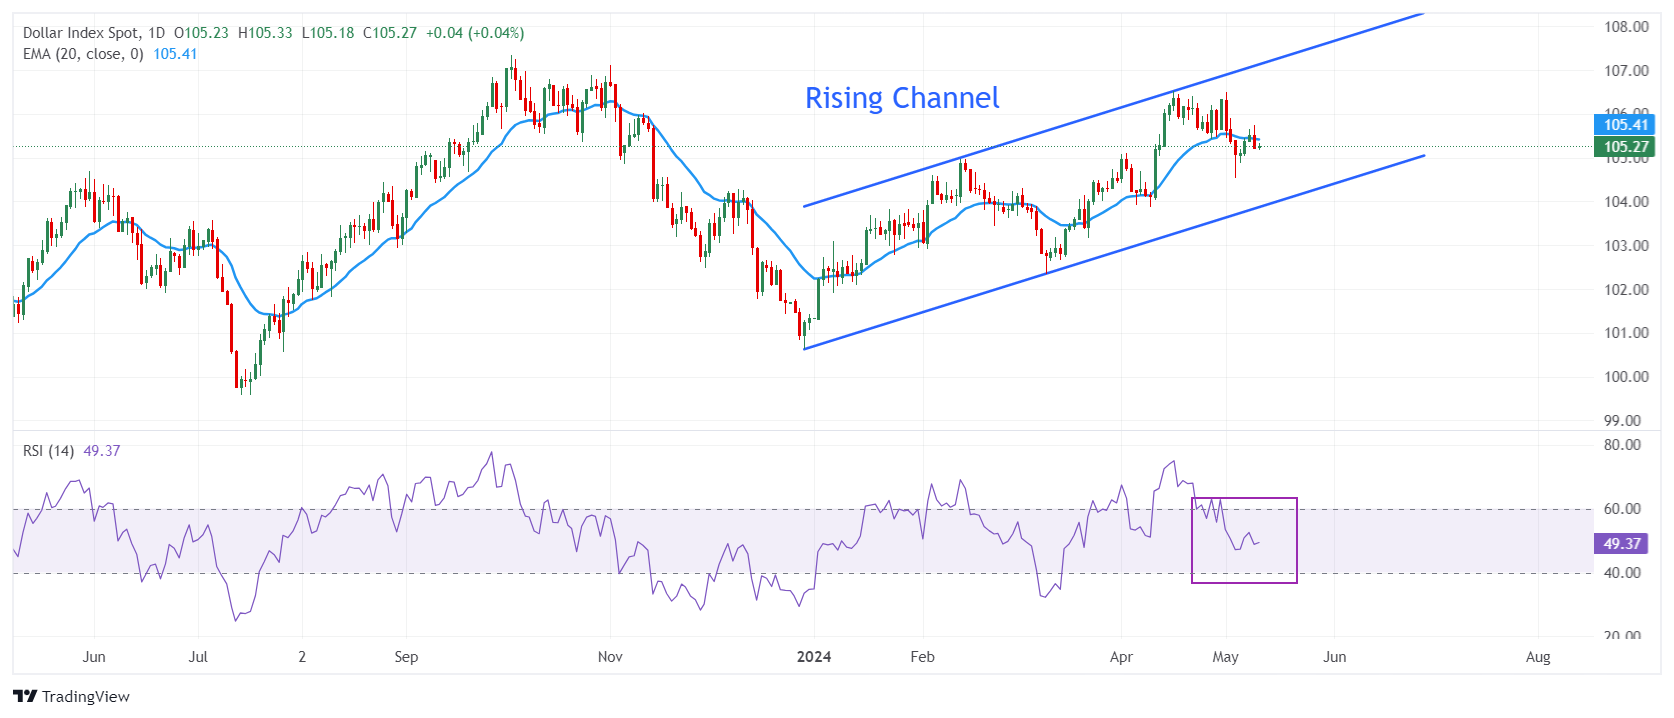
The USD Index trades in a Rising Channel chart pattern on a daily timeframe in which each corrective move is considered as buying opportunity by the market participants. The near-term outlook of the USD Index is uncertain as the asset fails to sustain above the 20-day Exponential Moving Average (EMA), which trades around 105.40.

The 14-period Relative Strength Index (RSI) oscillates in the 40.00-60.00, suggesting indecisiveness among market participants.

USD Index daily chart
Dollar Index Spot

Overview
Today last price 105.27
Today Daily Change 0.04
Today Daily Change % 0.04
Today daily open 105.23
 
Trends
Daily SMA20 105.77
Daily SMA50 104.67
Daily SMA100 103.94
Daily SMA200 104.27
 
Levels
Previous Daily High 105.74
Previous Daily Low 105.21
Previous Weekly High 106.49
Previous Weekly Low 104.53
Previous Monthly High 106.52
Previous Monthly Low 103.88
Daily Fibonacci 38.2% 105.41
Daily Fibonacci 61.8% 105.54
Daily Pivot Point S1 105.04
Daily Pivot Point S2 104.86
Daily Pivot Point S3 104.51
Daily Pivot Point R1 105.58
Daily Pivot Point R2 105.93
Daily Pivot Point R3 106.11


Disclaimer: For information purposes only. Past performance is not indicative of future results.
placeholder
Understanding the first crypto market crash of 2024 and what to expect nextThe 365-day MVRV ratio suggests that this crash may be just the beginning. If the ETF is rejected before the second quarter of 2024, it could trigger a sharp correction.
Author  FXStreet
Jan 04, Thu
The 365-day MVRV ratio suggests that this crash may be just the beginning. If the ETF is rejected before the second quarter of 2024, it could trigger a sharp correction.
placeholder
Natural Gas sinks to pivotal level as China’s demand slumpsNatural Gas price (XNG/USD) edges lower and sinks to $2.56 on Monday, extending its losing streak for the fifth day in a row. The move comes on the back of China cutting its Liquified Natural Gas (LNG) imports after prices rose above $3.0 in June. It
Author  FXStreet
Jul 01, Mon
Natural Gas price (XNG/USD) edges lower and sinks to $2.56 on Monday, extending its losing streak for the fifth day in a row. The move comes on the back of China cutting its Liquified Natural Gas (LNG) imports after prices rose above $3.0 in June. It
placeholder
Ethereum ETFs Debut: BlackRock Reigns With $260M Inflows, Grayscale BleedsNine spot Ethereum ETFs commenced trading on the US stock market on Tuesday, marking a pivotal moment for the crypto industry following the Securities and Exchange Commission’s (SEC) green light on Monday.
Author  NewsBTC
Jul 25, Thu
Nine spot Ethereum ETFs commenced trading on the US stock market on Tuesday, marking a pivotal moment for the crypto industry following the Securities and Exchange Commission’s (SEC) green light on Monday.
placeholder
Sooner Fed rate cuts may not save economy from recessionInvesting.com -- Sooner Federal Reserve rate cuts may not be enough to stop the central bank from falling behind the curve, throwing the economy and the current stock bull market into a wreck. The ris
Author  Investing.com
Yesterday 01: 13
Investing.com -- Sooner Federal Reserve rate cuts may not be enough to stop the central bank from falling behind the curve, throwing the economy and the current stock bull market into a wreck. The ris
placeholder
Ethereum Whales Rapidly Accumulate ETH Amid Price DeclineEthereum whales have been busy in the market, as on-chain data shows that these investors have been heavily accumulating the second-largest crypto token by market cap.
Author  NewsBTC
Yesterday 01: 17
Ethereum whales have been busy in the market, as on-chain data shows that these investors have been heavily accumulating the second-largest crypto token by market cap.
goTop
quote