


Dow Jones Industrial Average on the flat side but looking for higher ground in thin Monday trading
- Dow Jones recovers into fresh high but action remains tight.
- US equities broadly higher on Monday, but momentum is limited.
- Fedspeak to dominate headlines with quiet economic calendar this week.
The Dow Jones Industrial Average (DJIA) managed to gain some ground in today's quiet trading session, following the volatility caused by last week’s Nonfarm Payrolls (NFP) report. However, the market is still showing signs of weakness, with some stocks keeping the averages in check.
Fedspeak will be the key driver this week as investors try to pin down the likelihood of accelerated rate cuts from the Federal Reserve (Fed). The economic calendar is notably thin from the US this week, though traders will watch for Friday’s consumer sentiment survey results from the University of Michigan. The UoM Consumer Sentiment Index for May is expected to tick down to 77.0 from 77.2.
Dow Jones news
The Dow Jones is up a scant sixth of a percent on Monday as investors recover risk appetite on renewed hopes of Fed rate cuts, but upside momentum remains tight. Around half of the 30 securities that make up the Dow Jones Industrial Average are down or flat on the day.
Walt Disney Co. (DIS) leads the top of the Dow Jones gainers on Monday, climbing around 2% and trading near $116.00 per share ahead of Disney’s latest earnings report due Tuesday morning. On the low side, Amgen Inc. (AMGN) fell nearly 4% as traders pull back from the biotech stock following last week’s surge. Amgen is due to bring its own weight loss drug to market, a category of drugs that have seen wild demand surges and investors initally bet that Amgen would be able to carve out some of the high-demand drug market.
Dow Jones technical outlook
The Dow Jones climbed in early Monday trading to test a fresh daily high at 38,872.18 before a midday pullback to 38,687.46. The DJIA continues to trade north of 38,700.00 as equities look for firmer gains.
Longer-term, the Dow Jones is still trading into bullish territory above the 200-day Exponential Moving Average (EMA) at 36,798.86. Despite long-run bullish momentum, the Dow Jones has struggled to recover ground after falling back from March’s record peaks near the 40,000.00 price handle.
Dow Jones five-minute chart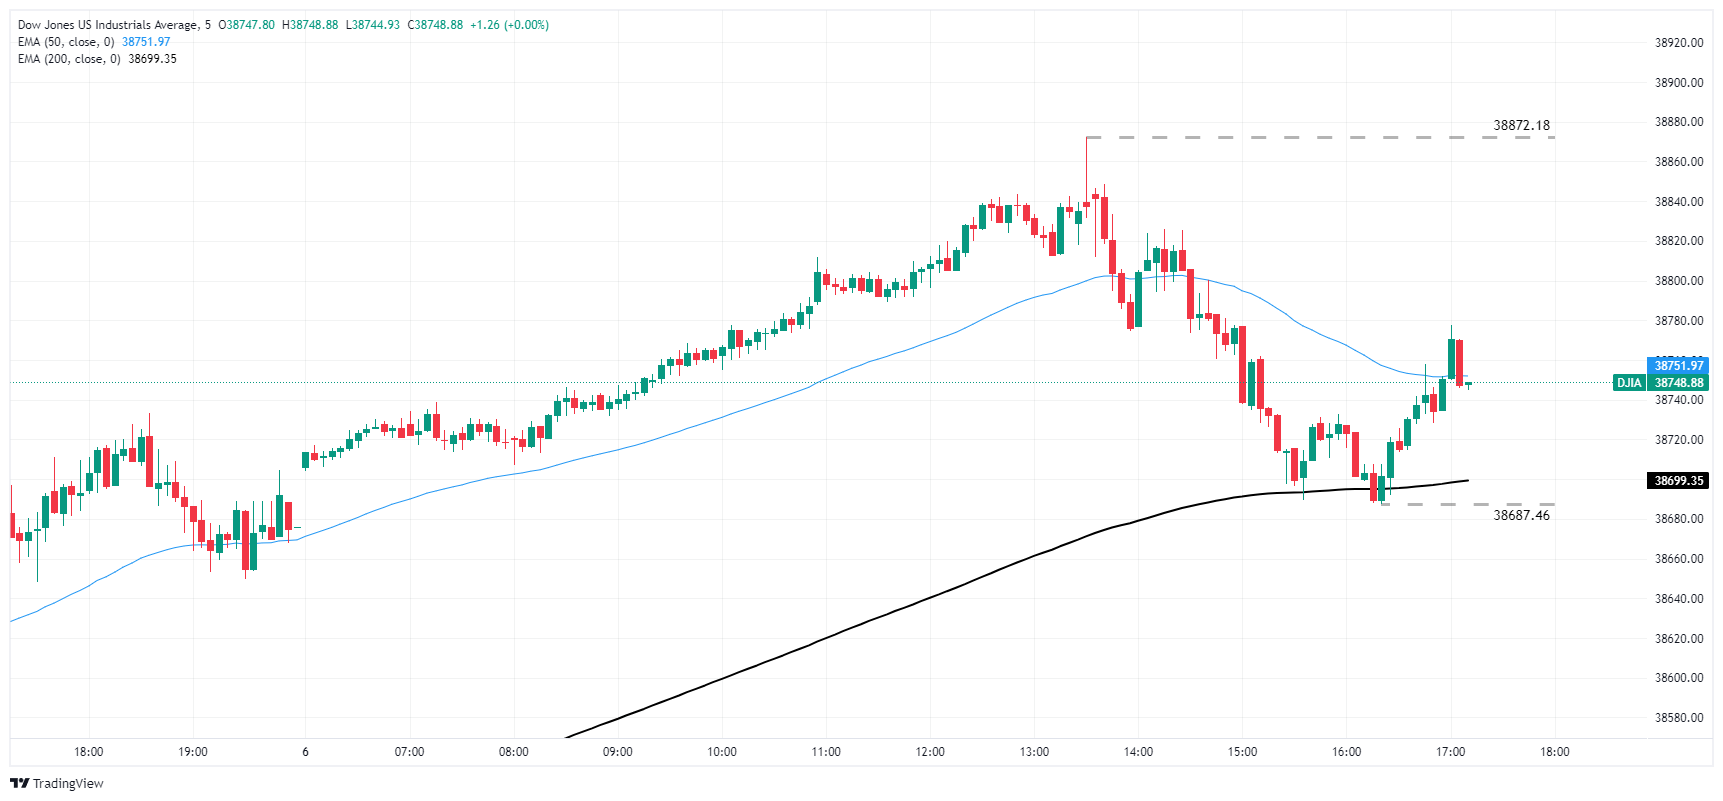
Dow Jones daily chart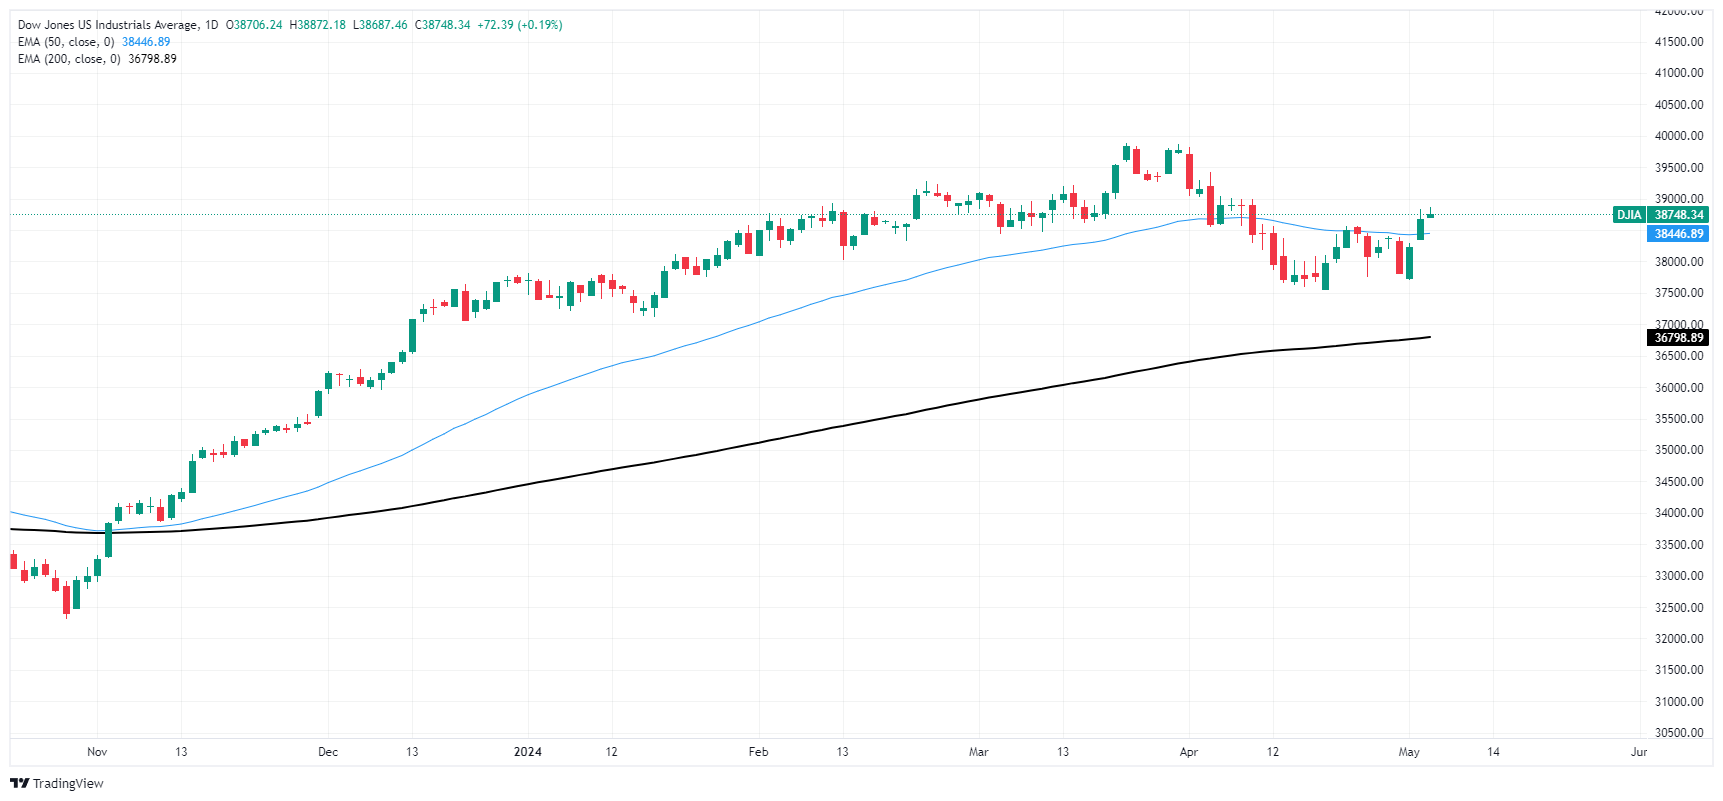
Dow Jones FAQs
The Dow Jones Industrial Average, one of the oldest stock market indices in the world, is compiled of the 30 most traded stocks in the US. The index is price-weighted rather than weighted by capitalization. It is calculated by summing the prices of the constituent stocks and dividing them by a factor, currently 0.152. The index was founded by Charles Dow, who also founded the Wall Street Journal. In later years it has been criticized for not being broadly representative enough because it only tracks 30 conglomerates, unlike broader indices such as the S&P 500.
Many different factors drive the Dow Jones Industrial Average (DJIA). The aggregate performance of the component companies revealed in quarterly company earnings reports is the main one. US and global macroeconomic data also contributes as it impacts on investor sentiment. The level of interest rates, set by the Federal Reserve (Fed), also influences the DJIA as it affects the cost of credit, on which many corporations are heavily reliant. Therefore, inflation can be a major driver as well as other metrics which impact the Fed decisions.
Dow Theory is a method for identifying the primary trend of the stock market developed by Charles Dow. A key step is to compare the direction of the Dow Jones Industrial Average (DJIA) and the Dow Jones Transportation Average (DJTA) and only follow trends where both are moving in the same direction. Volume is a confirmatory criteria. The theory uses elements of peak and trough analysis. Dow’s theory posits three trend phases: accumulation, when smart money starts buying or selling; public participation, when the wider public joins in; and distribution, when the smart money exits.
There are a number of ways to trade the DJIA. One is to use ETFs which allow investors to trade the DJIA as a single security, rather than having to buy shares in all 30 constituent companies. A leading example is the SPDR Dow Jones Industrial Average ETF (DIA). DJIA futures contracts enable traders to speculate on the future value of the index and Options provide the right, but not the obligation, to buy or sell the index at a predetermined price in the future. Mutual funds enable investors to buy a share of a diversified portfolio of DJIA stocks thus providing exposure to the overall index.
Recommended Articles


