

Gold Price Forecast: XAU/USD remains firm with $4,140 holding bears
- Gold approaches the $4,200 area, with downside attempts limited above $4,140.
- A mild rebound in US Yields is supporting the US Dollar and weighing on precious metals.
- XAU/USD v¡bylls are focusing on the November peaks, at $4,210 and $4,245.
Gold (XAU/USD) keeps crawling higher, and is on track to close the week 2.7% higher, with the US Dollar weighed by rising bets of Fed monetary easing. XAU/USD has been capped at $4,190 earlier on Friday, as the US Dollar picked up in a calm Thanksgiving session, but downside attempts remain limited above $4,140 so far.
The US Dollar Index, which measures the value of the US Dollar against a basket of six currencies, is picking up from lows on Friday, favoured by a mild rebound in US Treasury yields, but it remains on track for its worst weekly performance in months.
Dovish comments from Fed officials and weak US consumption figures have prompted investors to ramp up hopes of a Fed rate cut in December, which has sent US Treasury yields and the US Dollar tumbling this week.
Technical Analysis: Bulls are focusing on the $4,245 level
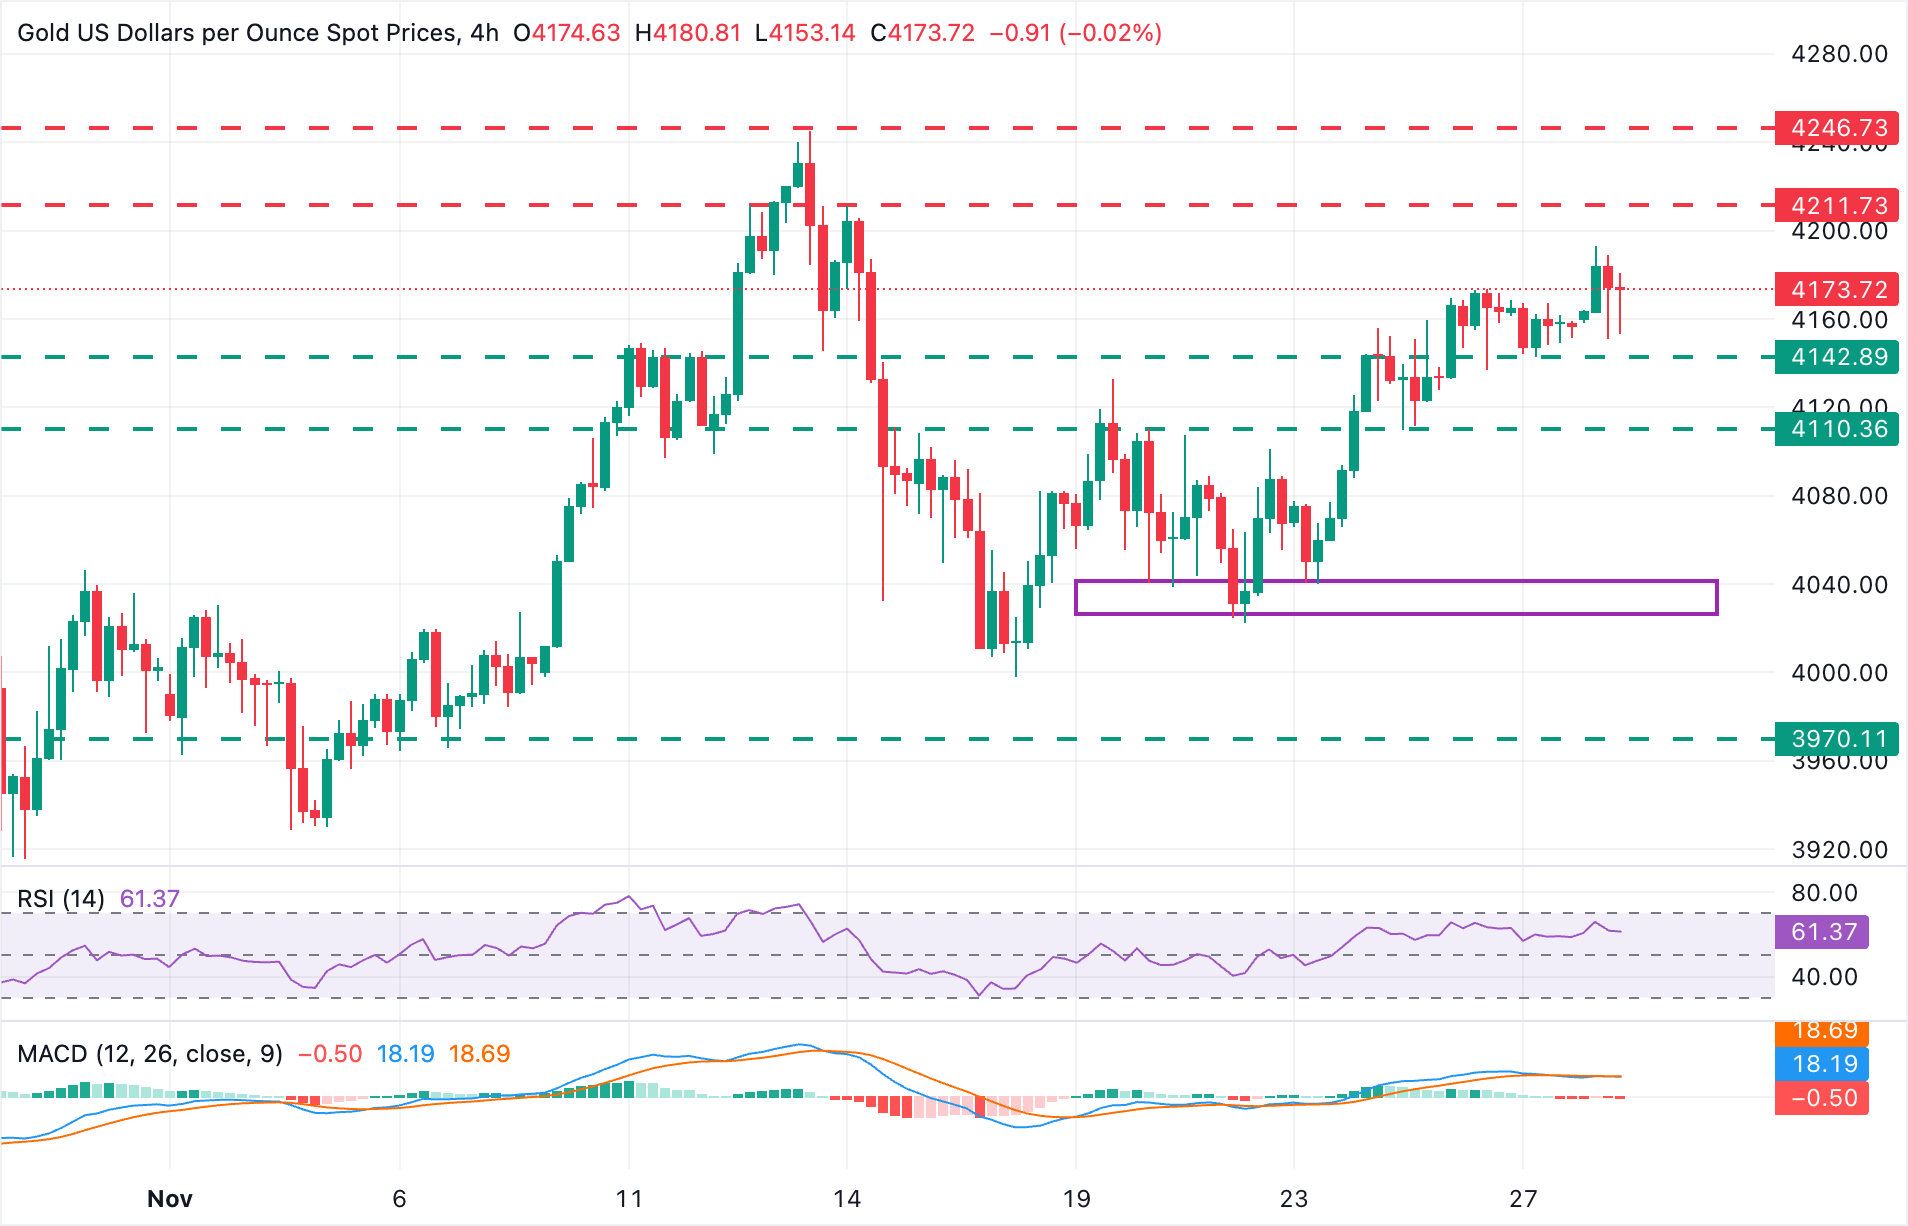
The technical picture remains positive. The 4-hour Relative Strength Index is trending higher, reaching levels past 60, and the Moving Average Convergence Divergence (MACD) has turned up and is crossing the signal line, highlighting growing bullish pressure.
The move above $4,100 confirmed that the bearish correction from the November peak is over, and bulls have shifted their focus to the November 14 high, at $4,210, on track for November’s peak, at $4,245.
On the downside, the mentioned $4,140 support (November 27 low) keeps the bullish trend in play. A bearish reaction below here brings the November 25 low, near $4,100, to the focus, ahead of the November 21 and 24 lows between $4.025 and $4,040.
US Dollar Price This week
The table below shows the percentage change of US Dollar (USD) against listed major currencies this week. US Dollar was the strongest against the Japanese Yen.
| USD | EUR | GBP | JPY | CAD | AUD | NZD | CHF | |
|---|---|---|---|---|---|---|---|---|
| USD | -0.41% | -0.81% | -0.22% | -0.42% | -0.99% | -1.60% | -0.25% | |
| EUR | 0.41% | -0.39% | 0.20% | -0.02% | -0.60% | -1.20% | 0.16% | |
| GBP | 0.81% | 0.39% | 0.58% | 0.38% | -0.21% | -0.80% | 0.56% | |
| JPY | 0.22% | -0.20% | -0.58% | -0.22% | -0.84% | -1.52% | -0.03% | |
| CAD | 0.42% | 0.02% | -0.38% | 0.22% | -0.58% | -1.18% | 0.18% | |
| AUD | 0.99% | 0.60% | 0.21% | 0.84% | 0.58% | -0.59% | 0.80% | |
| NZD | 1.60% | 1.20% | 0.80% | 1.52% | 1.18% | 0.59% | 1.38% | |
| CHF | 0.25% | -0.16% | -0.56% | 0.03% | -0.18% | -0.80% | -1.38% |
The heat map shows percentage changes of major currencies against each other. The base currency is picked from the left column, while the quote currency is picked from the top row. For example, if you pick the US Dollar from the left column and move along the horizontal line to the Japanese Yen, the percentage change displayed in the box will represent USD (base)/JPY (quote).
Recommended Articles


