

Dow Jones Industrial Average early rally halted by Retail Sales miss
- The Dow touched a fresh all-time intraday high above 50,500 on Tuesday, extending its record-breaking run from last week.
- December retail sales came in flat, badly missing expectations of 0.4% growth, as holiday-season spending lost steam.
- Software stocks rebounded sharply, with Datadog and ServiceNow bouncing on earnings beats and bargain hunting after last week's selloff.
- Commerce Secretary Howard Lutnick reiterated his call for 5-6% GDP growth in 2026, contingent on Federal Reserve rate cuts.
The Dow Jones Industrial Average (DJIA) extended its record streak on Tuesday, touching a fresh all-time intraday high of 50,509.22 before settling at 50,259.81, up 123.57 points or 0.25%. The index has now scored its fourth consecutive intraday record, building on the momentum that carried it above the 50,000 milestone for the first time last week. The S&P 500 gained 0.47% to close at 6,964.82, while the Nasdaq Composite rose 0.90% to 23,238.67. Gains were broad-based, led by software stocks snapping back from last week's AI-driven selloff, while financial and entertainment names provided further tailwinds for the blue-chip Dow.
December retail sales fall flat, miss expectations across the board
The Commerce Department reported that December Retail Sales were unchanged MoM at $735 billion, a sharp deceleration from November's 0.6% gain and well below the 0.4% increase economists had expected. Excluding autos, sales were also flat versus expectations of a 0.3% gain. The control group, which feeds directly into Gross Domestic Product (GDP) calculations, contracted 0.1%. Declines were broad, with furniture stores and miscellaneous retailers each dropping 0.9%, while auto dealers slipped 0.2%. The weak data painted a picture of a consumer losing momentum heading into the year-end holiday season, and rate traders wasted no time repricing expectations, increasing bets on more than two Federal Reserve (Fed) rate cuts this year. The Bureau of Labor Statistics (BLS) also reported that the Employment Cost Index (ECI) rose just 0.7% in the fourth quarter, below the 0.8% consensus and the slowest pace since Q3 2020, adding further weight to the dovish case.
Lutnick doubles down on bullish growth outlook
Commerce Secretary Howard Lutnick continued to push his ambitious growth narrative, reiterating projections of 5%+ GDP growth in the first quarter of 2026 and suggesting that 6% is achievable if the Fed cuts rates. Speaking on the All-In Podcast in January, Lutnick attributed the optimistic outlook to over 30 major construction projects and new factory buildouts stemming from $18 trillion in pledged investments. He also pointed to the administration's revamped CHIPS Act deals with firms like Taiwan Semiconductor Manufacturing Company (TSM) and Nvidia (NVDA) as key catalysts for domestic manufacturing growth. Treasury Secretary Scott Bessent has offered a more conservative 4-5% estimate, while mainstream forecasters remain skeptical, with the International Monetary Fund (IMF) pegging US growth at 2.1% for the year.
Software stocks snap back as earnings deliver
The software sector staged a sharp rebound on Tuesday after last week's brutal selloff, which was triggered by AI spending concerns following disappointing results from several hyperscalers. Datadog Inc. (DDOG) surged 15% after its fourth-quarter results beat expectations on key metrics, while ServiceNow Inc. (NOW) bounced 4%. Spotify Technology S.A. (SPOT) jumped over 16% after reporting a record 38 million monthly active user additions in the fourth quarter, reaching 751 million total users and comfortably beating Wall Street's 745 million estimate. Goldman Sachs upgraded the stock to Buy with a $700 price target. On the losing side, S&P Global Inc. (SPGI) plunged roughly 16% after issuing 2026 earnings guidance of $19.40-$19.65 per share, well below the $19.96 consensus, while The Coca-Cola Company (KO) fell over 4% as its 2026 organic sales outlook of 4-5% disappointed investors after a strong run-up in the stock this year.
Chipmakers grind higher on TSMC revenue surge
Semiconductor stocks added to gains on Tuesday after Taiwan Semiconductor Manufacturing Company (TSM) reported its highest monthly revenue on record. January revenue came in at NT$401.26 billion (approximately $12.71 billion), up 36.8% YoY and 19.8% from December, reinforcing the narrative that global AI spending remains robust despite recent market jitters. Nvidia, Advanced Micro Devices Inc. (AMD), and Broadcom Inc. (AVGO) each added roughly 1% on the session. The Walt Disney Company (DIS) rose over 2.5% to lead Dow gainers, alongside American Express Company (AXP) and Salesforce Inc. (CRM), while healthcare names including Amgen Inc. (AMGN) and Merck & Co. Inc. (MRK) dragged on the index.
Dow Jones technicals
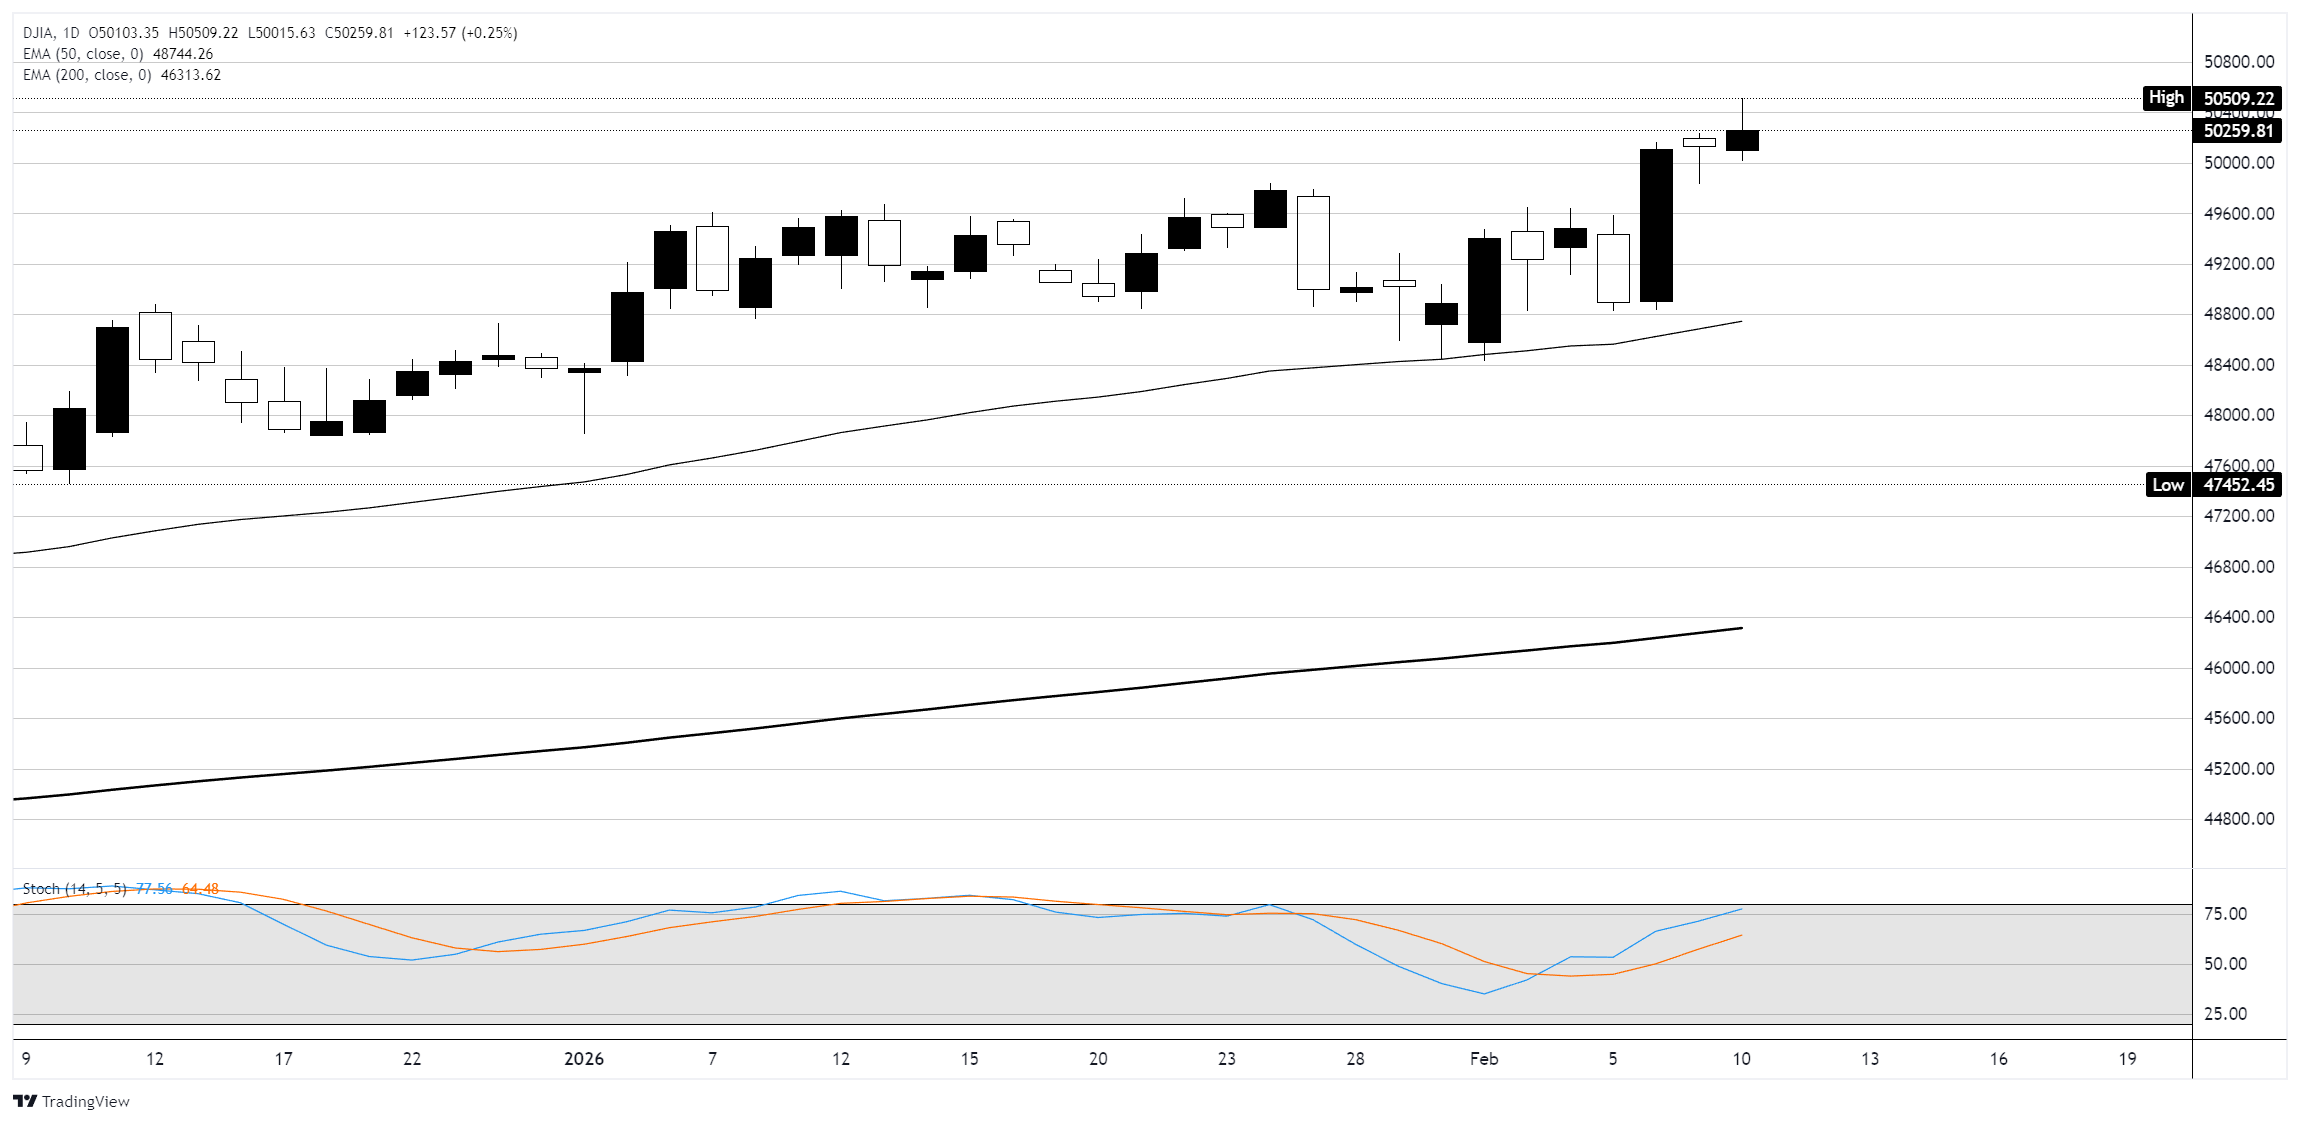
The Dow continues to trade in a strong uptrend, with Tuesday's intraday high of 50,509.22 marking a fresh all-time record bid. The index is comfortably above both its 50-day EMA at 48,744 and its 200-day EMA at 46,314, reflecting broad bullish momentum. The Stochastic oscillator is approaching overbought territory at 77.96/64.48, which could signal some near-term consolidation. Key support sits at the 50,000 psychological level, with the prior breakout zone around 49,600 providing a secondary floor. To the upside, traders will be watching for a sustained close above 50,500 to confirm the breakout to new highs.
Dow Jones daily chart
Dow Jones FAQs
The Dow Jones Industrial Average, one of the oldest stock market indices in the world, is compiled of the 30 most traded stocks in the US. The index is price-weighted rather than weighted by capitalization. It is calculated by summing the prices of the constituent stocks and dividing them by a factor, currently 0.152. The index was founded by Charles Dow, who also founded the Wall Street Journal. In later years it has been criticized for not being broadly representative enough because it only tracks 30 conglomerates, unlike broader indices such as the S&P 500.
Many different factors drive the Dow Jones Industrial Average (DJIA). The aggregate performance of the component companies revealed in quarterly company earnings reports is the main one. US and global macroeconomic data also contributes as it impacts on investor sentiment. The level of interest rates, set by the Federal Reserve (Fed), also influences the DJIA as it affects the cost of credit, on which many corporations are heavily reliant. Therefore, inflation can be a major driver as well as other metrics which impact the Fed decisions.
Dow Theory is a method for identifying the primary trend of the stock market developed by Charles Dow. A key step is to compare the direction of the Dow Jones Industrial Average (DJIA) and the Dow Jones Transportation Average (DJTA) and only follow trends where both are moving in the same direction. Volume is a confirmatory criteria. The theory uses elements of peak and trough analysis. Dow’s theory posits three trend phases: accumulation, when smart money starts buying or selling; public participation, when the wider public joins in; and distribution, when the smart money exits.
There are a number of ways to trade the DJIA. One is to use ETFs which allow investors to trade the DJIA as a single security, rather than having to buy shares in all 30 constituent companies. A leading example is the SPDR Dow Jones Industrial Average ETF (DIA). DJIA futures contracts enable traders to speculate on the future value of the index and Options provide the right, but not the obligation, to buy or sell the index at a predetermined price in the future. Mutual funds enable investors to buy a share of a diversified portfolio of DJIA stocks thus providing exposure to the overall index.
Recommended Articles


