

Dow Jones dips into negative territory with hawkish Fed weighing on sentiment
- Dow Jones index dips into losses following positive market opening.
- Investors’ concerns about the Fed’s “higher for longer” stance are weighing on risk appetite.
- Technical picture remains bearish with DJIA retreating from historic highs reached in March.
The Dow Jones Industrial Average (DJIA) is posting losses after a positive opening on Wednesday. Investors’ concerns about the hawkish comments by Federal Reserve (Fed) Chair Jerome Powell on Tuesday and a string of downbeat quarterly earrings have soured market sentiment.
Powell observed the lack of progress on inflation on Tuesday and resumed the “higher for longer” monetary policy outlook, which is acting to dampen investors’ appetite for risk.
Beyond that, quarterly earnings data disappointed on Wednesday with Travelers Companies (TRV) reporting profits below estimates, while US Bancorp’s (USB) net interest income fell by 14% in Q1.
The main Wall Street indices are in the red. The NASDAQ is leading losses with a 0.63% decline to 15,769, followed by the S&P 500, down 0.44% to 5,028, and the Dow Jones, off 0.3% to 37,693.
Dow Jones news
The Technology sector is the worst performer on Wednesday, dropping 1.1%, weighed down by the outlook of high rates for a longer time. Industrials are following on Wednesday with a 0.75% decline. On the positive side, Utilities are up 0.8%, while Materials appreciate 0.2%.
Travelers Companies (TRV) plunges 8.2% to $204.99 following downbeat quarterly earnings. Intel (INTC)l is next with a 1.9% drop to $35.57. United Health is the best performer, with a 2.7% rally to $481.53, followed by Goldman Sachs (GS) with a 1.38% gain to $402.33.
Dow Jones technical outlook
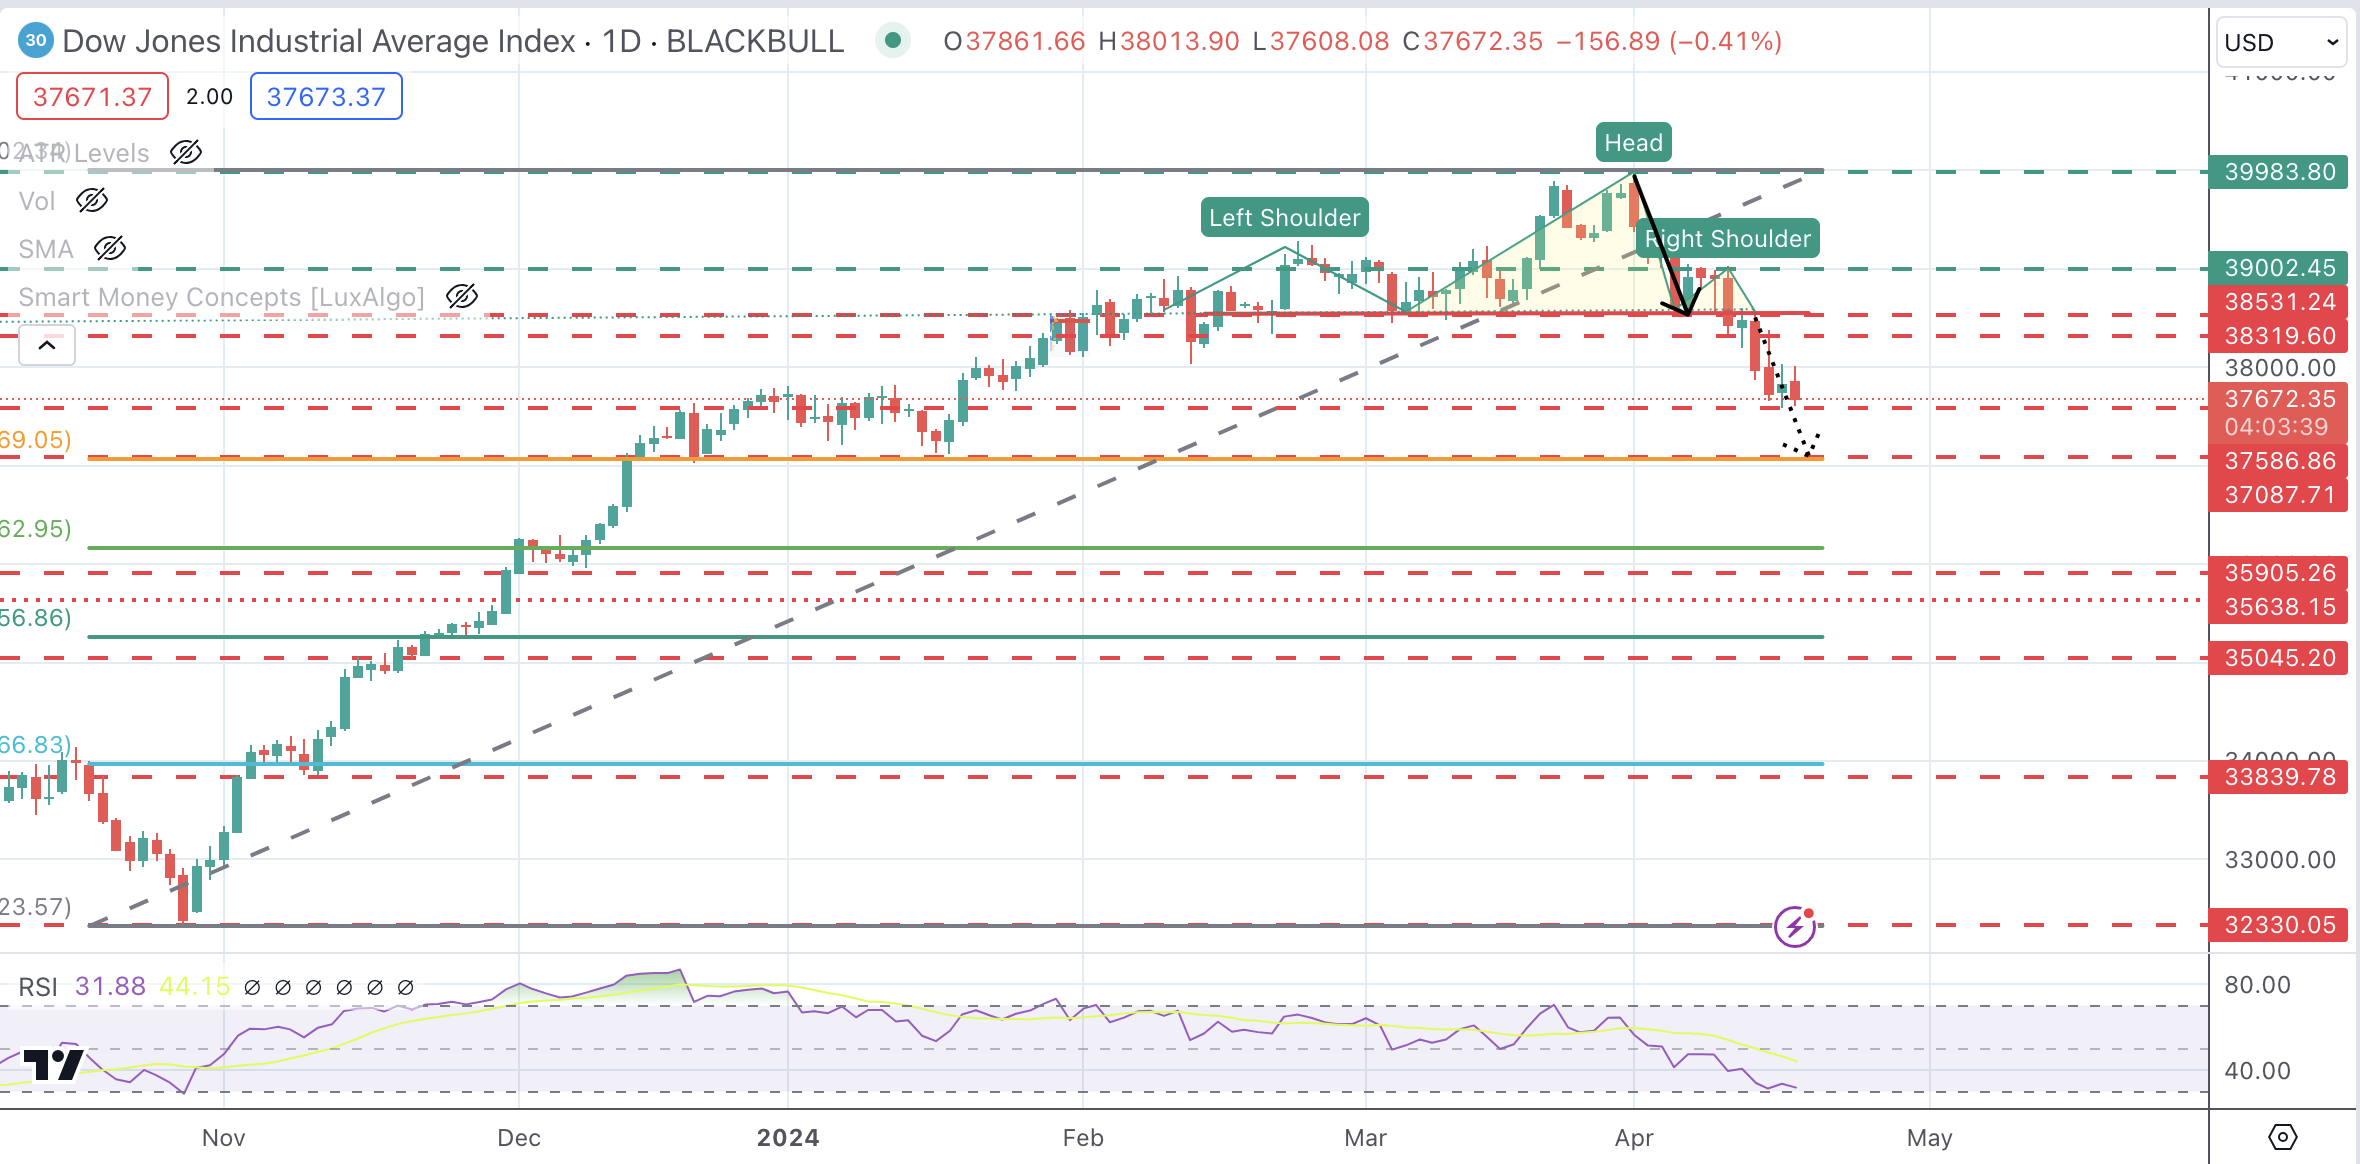
The DJIA index has reversed earlier gains and maintains an overall bearish picture intact. The move below 38,560 has activated a Head & Shoulders pattern that points toward a sharper decline.
Immediate support is 37,586, followed by the measured target of the H&S pattern, which meets the mid-January low and 38.6% Fibonacci retracement at 37,087. A bullish reaction might find resistance at the 38,531 previous support ahead of the 39,000 region (order block).
Dow Jones Index Daily Chart
Nasdaq FAQs
The Nasdaq is a stock exchange based in the US that started out life as an electronic stock quotation machine. At first, the Nasdaq only provided quotations for over-the-counter (OTC) stocks but later it became an exchange too. By 1991, the Nasdaq had grown to account for 46% of the entire US securities’ market. In 1998, it became the first stock exchange in the US to provide online trading. The Nasdaq also produces several indices, the most comprehensive of which is the Nasdaq Composite representing all 2,500-plus stocks on the Nasdaq, and the Nasdaq 100.
The Nasdaq 100 is a large-cap index made up of 100 non-financial companies from the Nasdaq stock exchange. Although it only includes a fraction of the thousands of stocks in the Nasdaq, it accounts for over 90% of the movement. The influence of each company on the index is market-cap weighted. The Nasdaq 100 includes companies with a significant focus on technology although it also encompasses companies from other industries and from outside the US. The average annual return of the Nasdaq 100 has been 17.23% since 1986.
There are a number of ways to trade the Nasdaq 100. Most retail brokers and spread betting platforms offer bets using Contracts for Difference (CFD). For longer-term investors, Exchange-Traded Funds (ETFs) trade like shares that mimic the movement of the index without the investor needing to buy all 100 constituent companies. An example ETF is the Invesco QQQ Trust (QQQ). Nasdaq 100 futures contracts allow traders to speculate on the future direction of the index. Options provide the right, but not the obligation, to buy or sell the Nasdaq 100 at a specific price (strike price) in the future.
Many different factors drive the Nasdaq 100 but mainly it is the aggregate performance of the component companies revealed in their quarterly and annual company earnings reports. US and global macroeconomic data also contributes as it impacts on investor sentiment, which if positive drives gains. The level of interest rates, set by the Federal Reserve (Fed), also influences the Nasdaq 100 as it affects the cost of credit, on which many corporations are heavily reliant. As such the level of inflation can be a major driver too as well as other metrics which impact on the decisions of the Fed.
Recommended Articles


