


XRP price uptrend stalls, triggering liquidations amid neutral spot retail activity
- XRP rally cools below record highs at $3.66 as leading altcoins strive to sustain recently accrued gains.
- Liquidations amount to $24 million over the past 24 hours amid overheated market conditions with the RSI at 81.
- XRP’s spot retail activity remains neutral despite the surge to a new record high, suggesting that there’s still potential for a breakout.
Ripple (XRP) is struggling to hold onto most of the gains accrued since its June lows at $1.90, reaching a new all-time high of $3.66 on Friday. A nearly 2% decline on Tuesday sees the cross-border money remittance token exchange hands at around $3.47.
Key technical indicators suggest relatively overheated market conditions, likely to catalyze an extended pullback before XRP resumes the uptrend and begins a fresh price discovery phase.
XRP uptrend falters, triggering liquidations
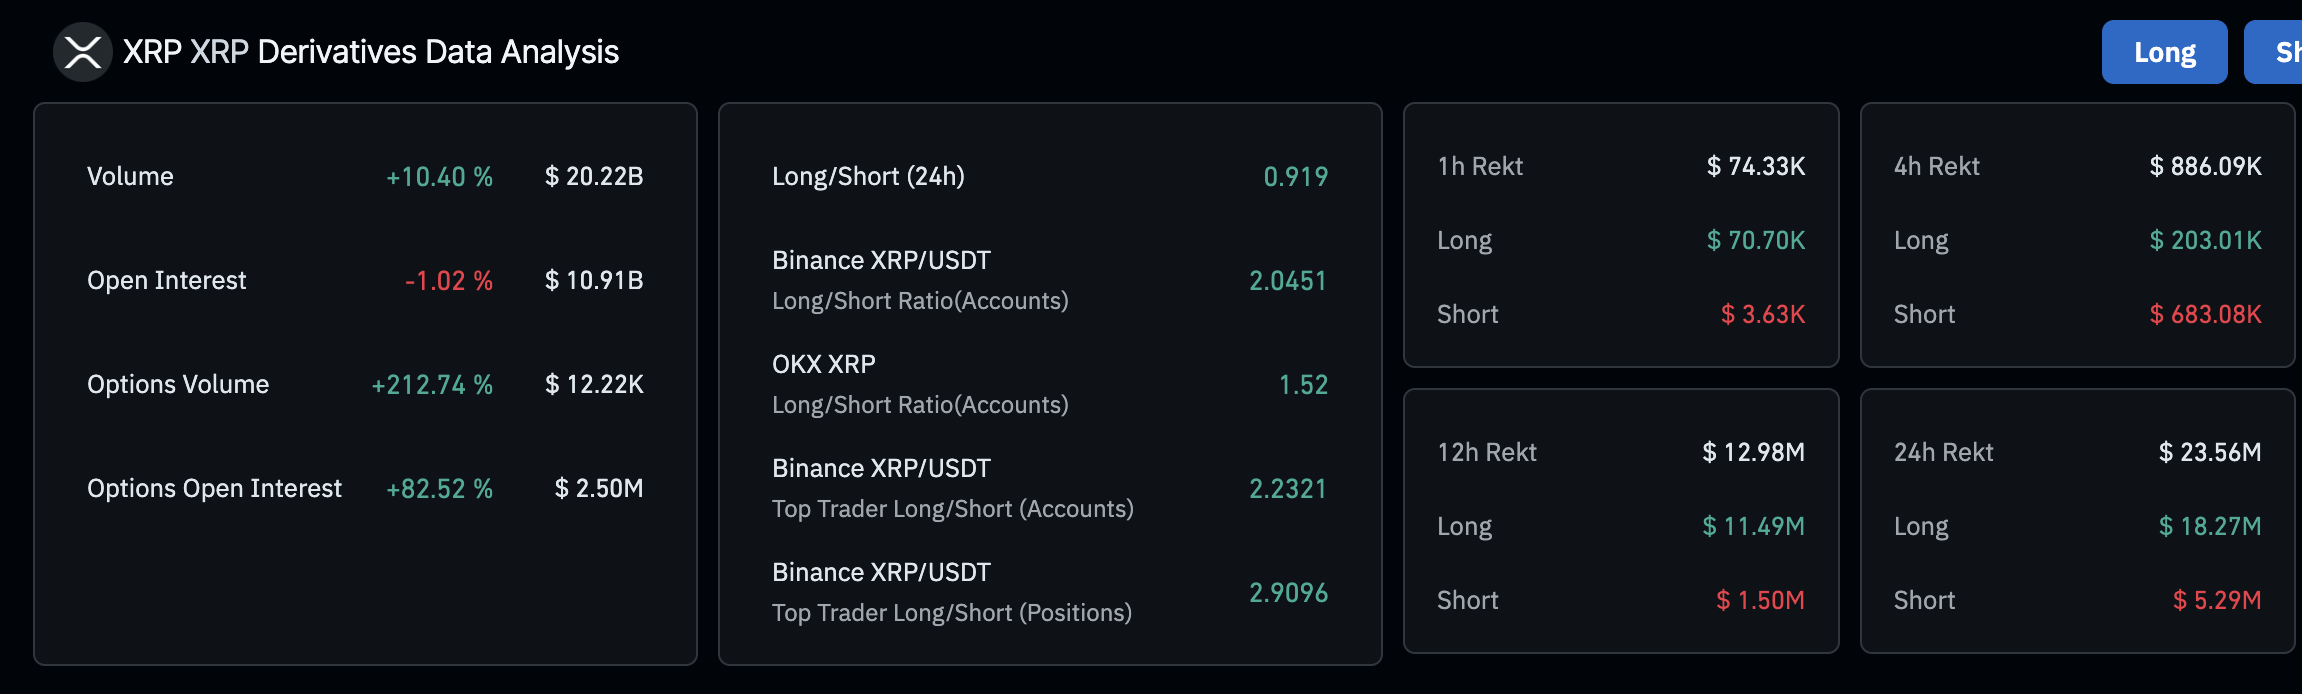
XRP bulls are accelerating the decline toward the previous record high at $3.40, leaving bullishly aligned traders counting losses. According to CoinGlass, approximately $24 million has been wiped out over the past 24 hours. Long position holders are bearing the biggest brunt of the weakening uptrend with liquidations amounting to $18.27 million compared to $5.29 million in shorts.
The subsequent increase in trading volume to $20.22 billion over the same period suggests selling pressure is rising with leveraged positions being forcibly closed.
XRP derivatives market data
Despite the increase in liquidations, the surge in the XRP futures Open Interest (OI) to $10.94 billion shows no sign of fatigue among the bulls. Open Interest refers to the value of all the futures and options contracts that have not been settled or closed.
A persistent increase in this indicator reveals that traders are betting on XRP price steadying the uptrend and stepping into price discovery above $3.66.
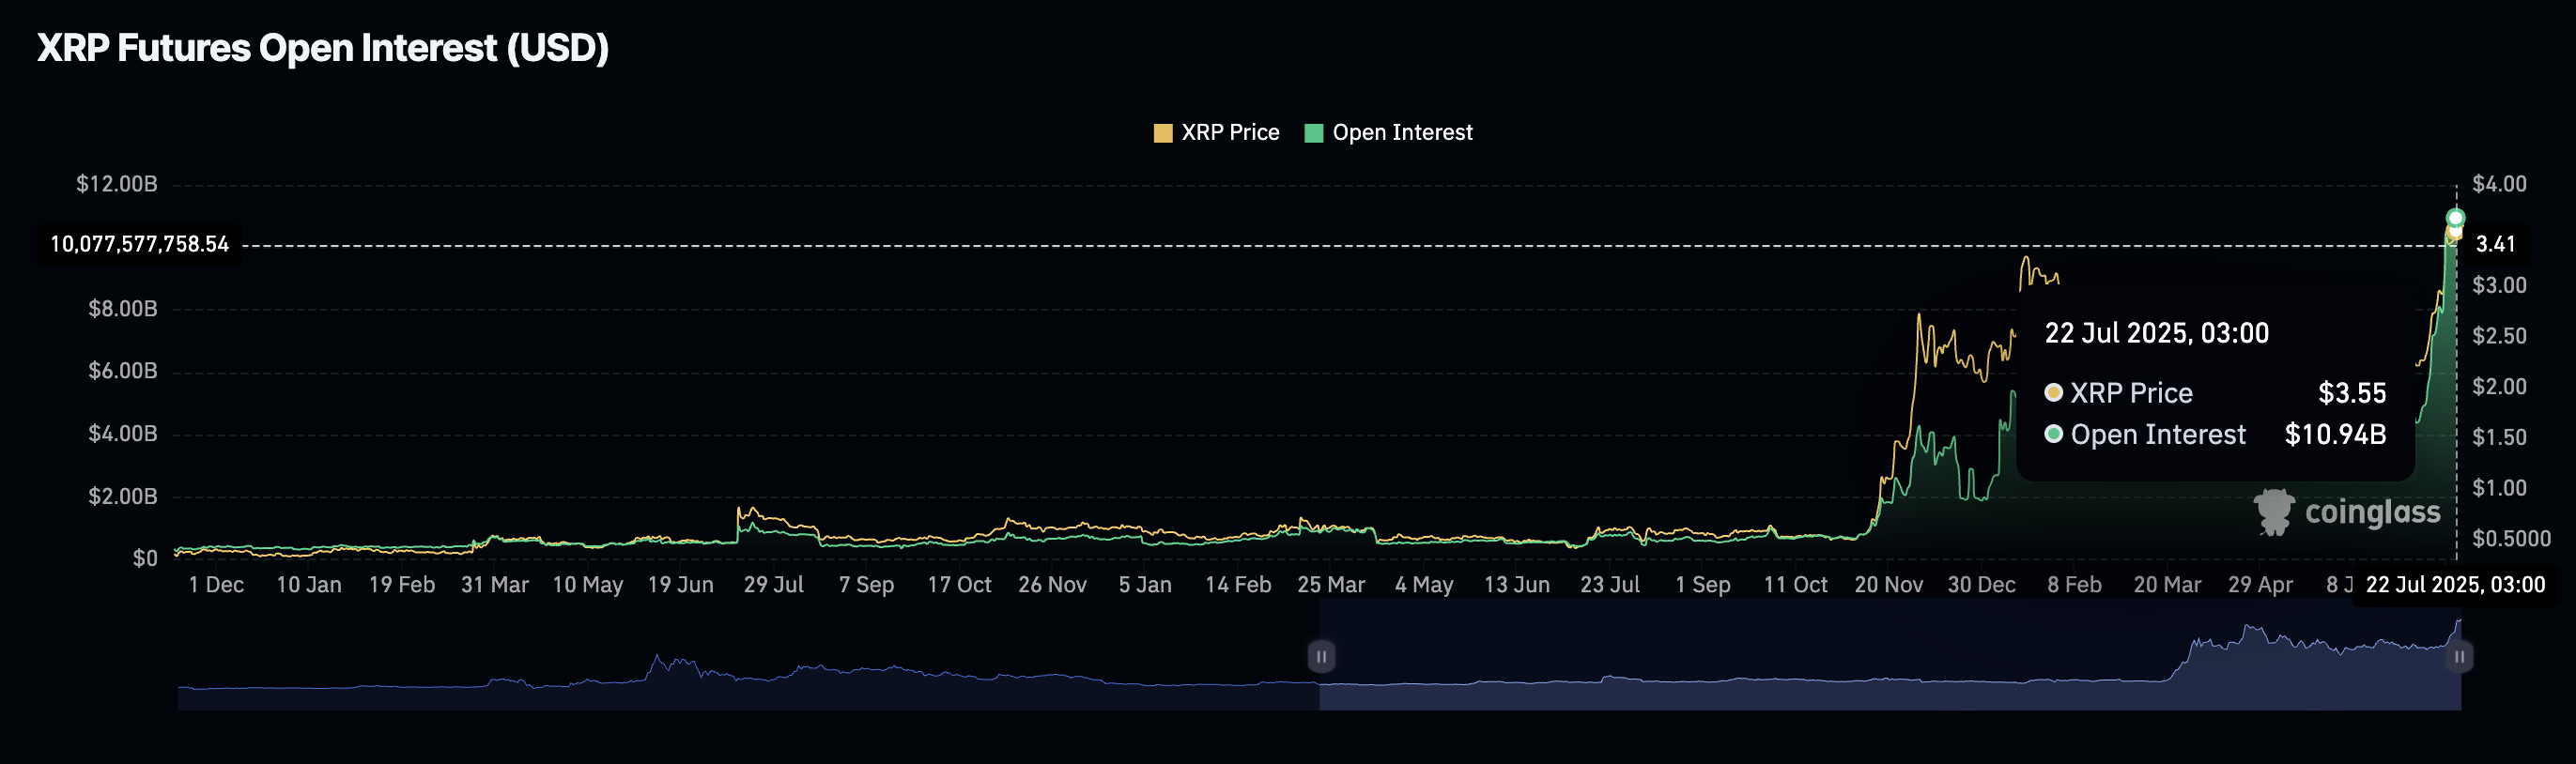
XRP Futures Open Interest | Source: CoinGlass
CryptoQuant’s XRP Ledger Spot Retail Activity Through Trading Frequency Surge metric indicates that retail activity remains neutral. The indicator measures the activity level of retail investors in XRP based on their trading frequency.
At the current neutral level, retail investors are still entering XRP markets, hinting at an increase in speculative demand. This means that the weakness being experienced could be temporary, allowing for profit-taking activity ahead of the next breakout.
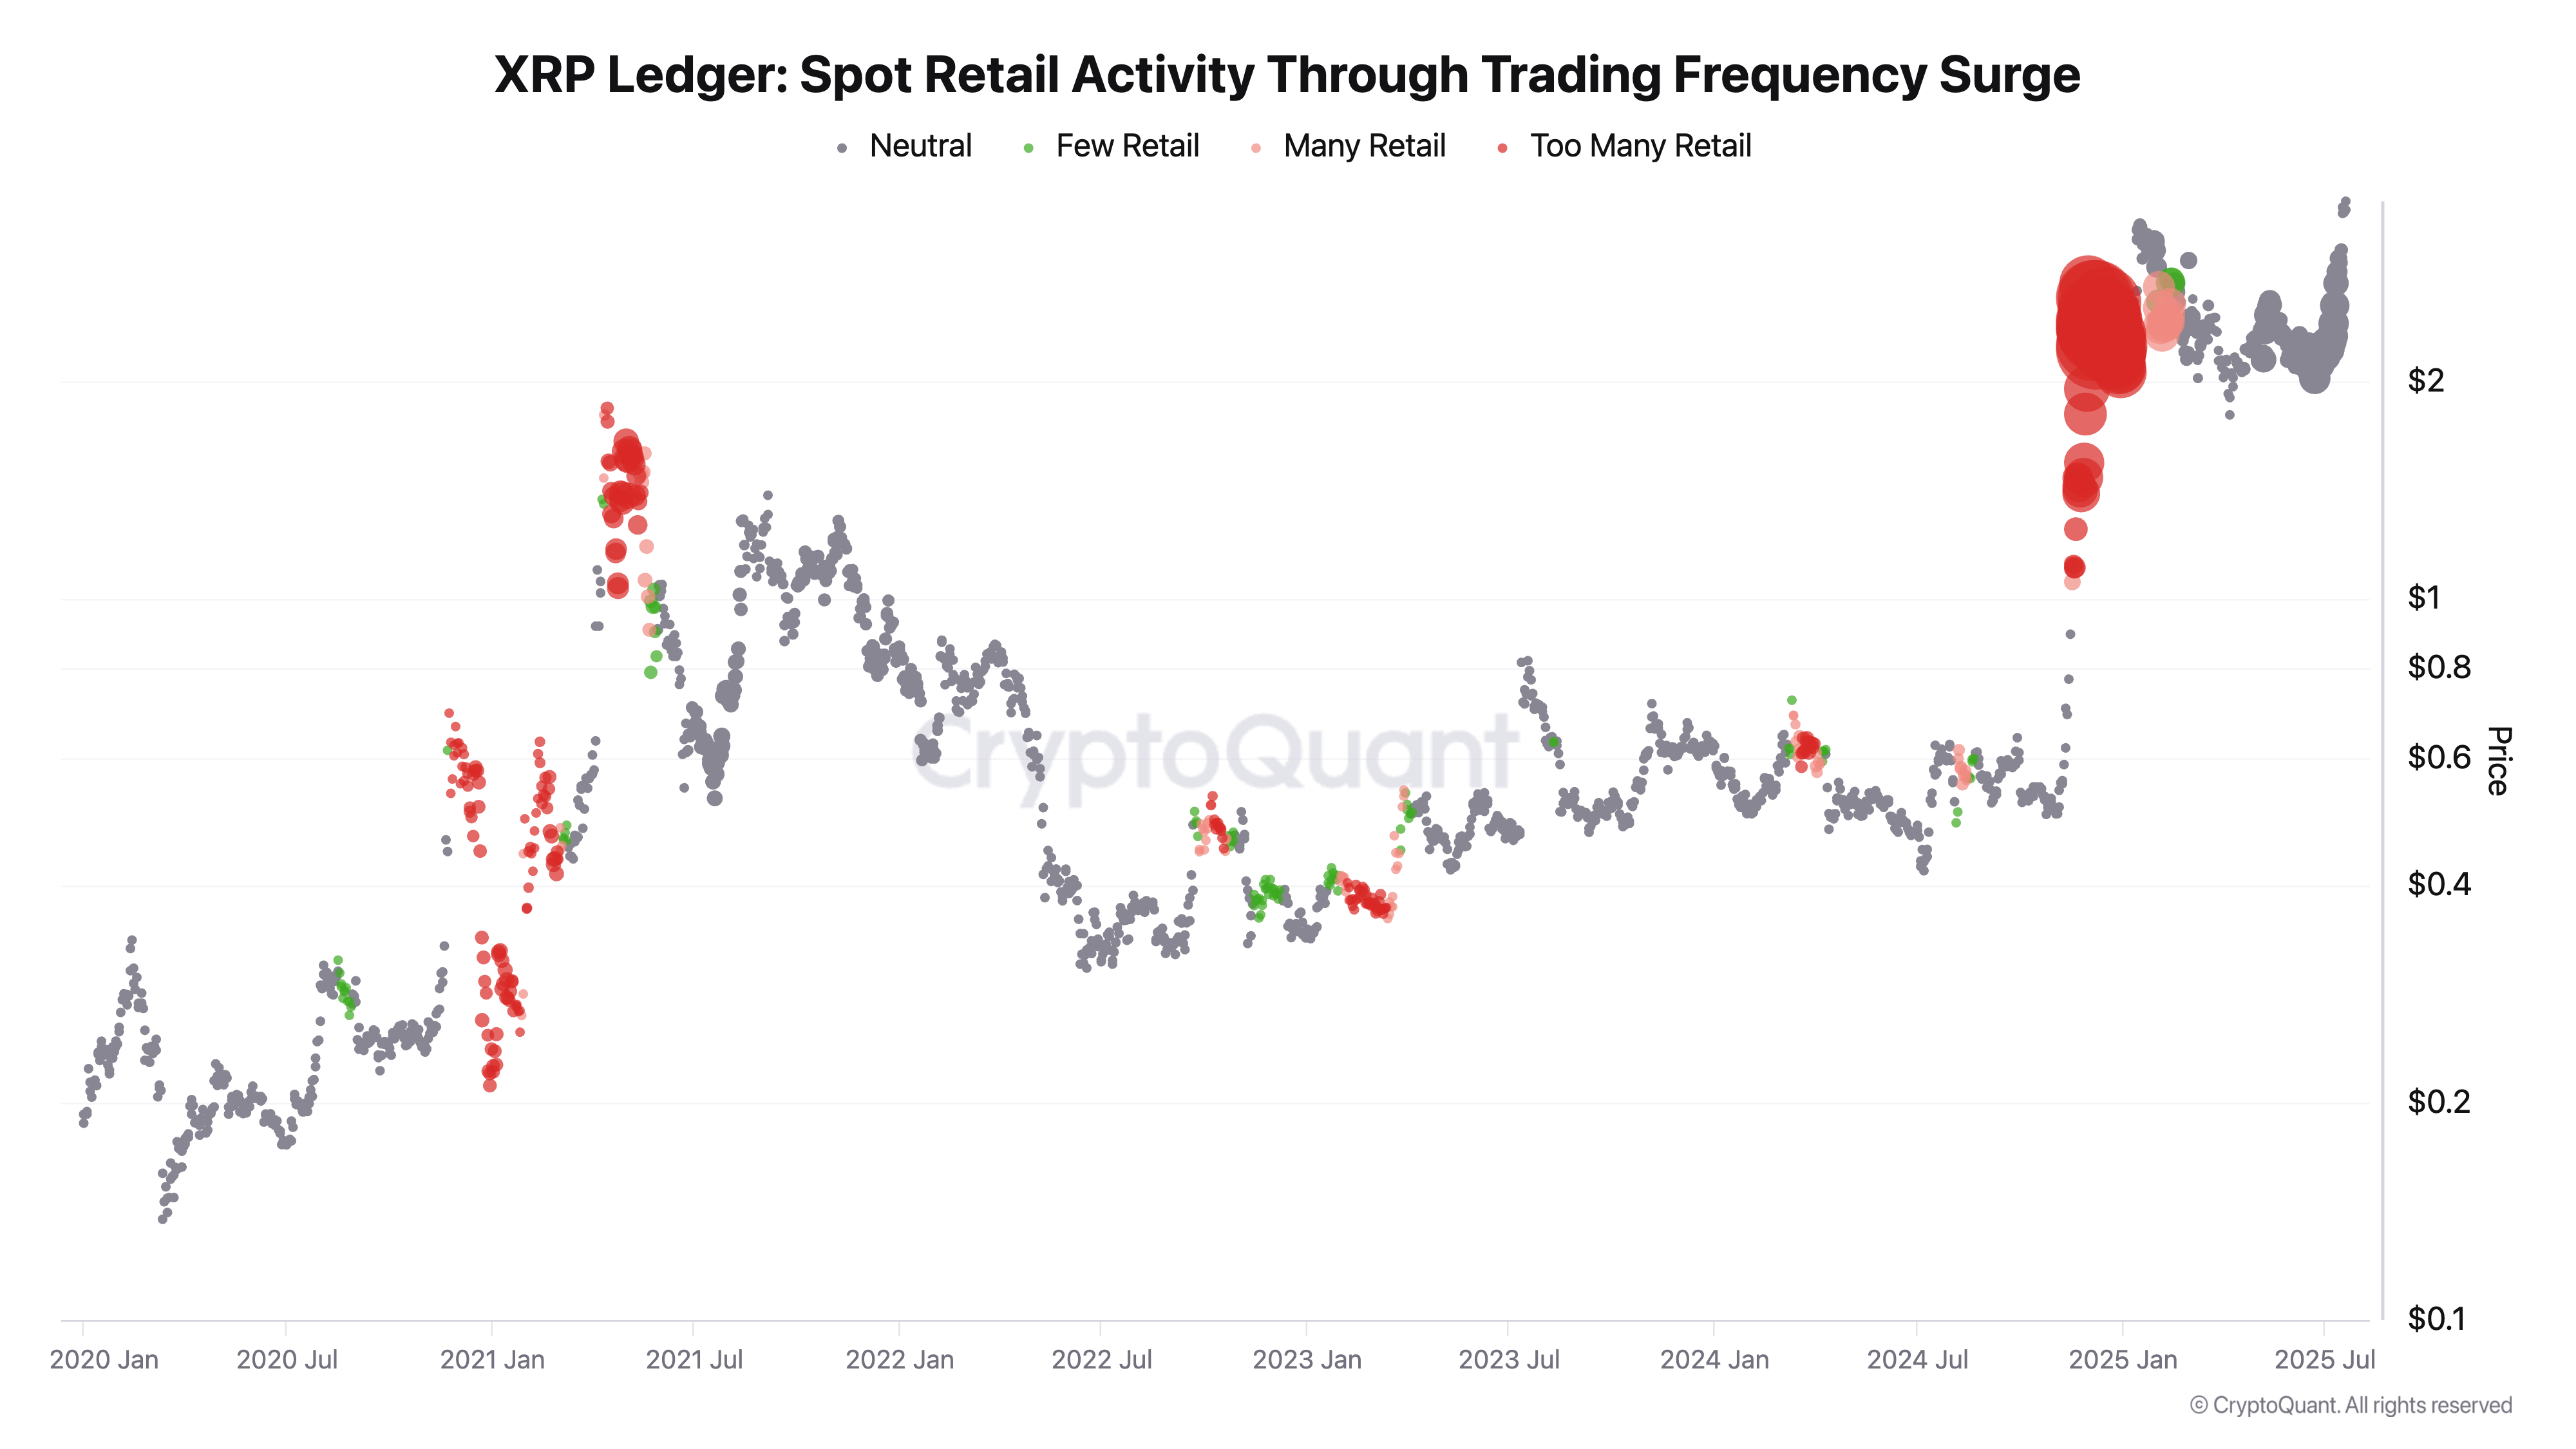
XRP Ledger’s Spot Retail Activity Through Trading Frequency | Source: CryptoQuant
Technical outlook: XRP bullish structure is intact
XRP price is currently holding between its all-time high of $3.66 and the previous record high of $3.40. The token faces an increasing supply amid reduced buying pressure, as evidenced by the Relative Strength Index (RSI) still being overbought but dropping to 81.
If the RSI continues to decline, it will indicate that bearish momentum is building. Losses below the $3.40 level could trigger a sell-off as investors rush to protect their capital by reducing exposure.
Other key support areas traders could monitor include $3.00, which was traded as resistance last week and in early March, as well as the 50-day Exponential Moving Average (EMA) at $2.60, if declines accelerate.
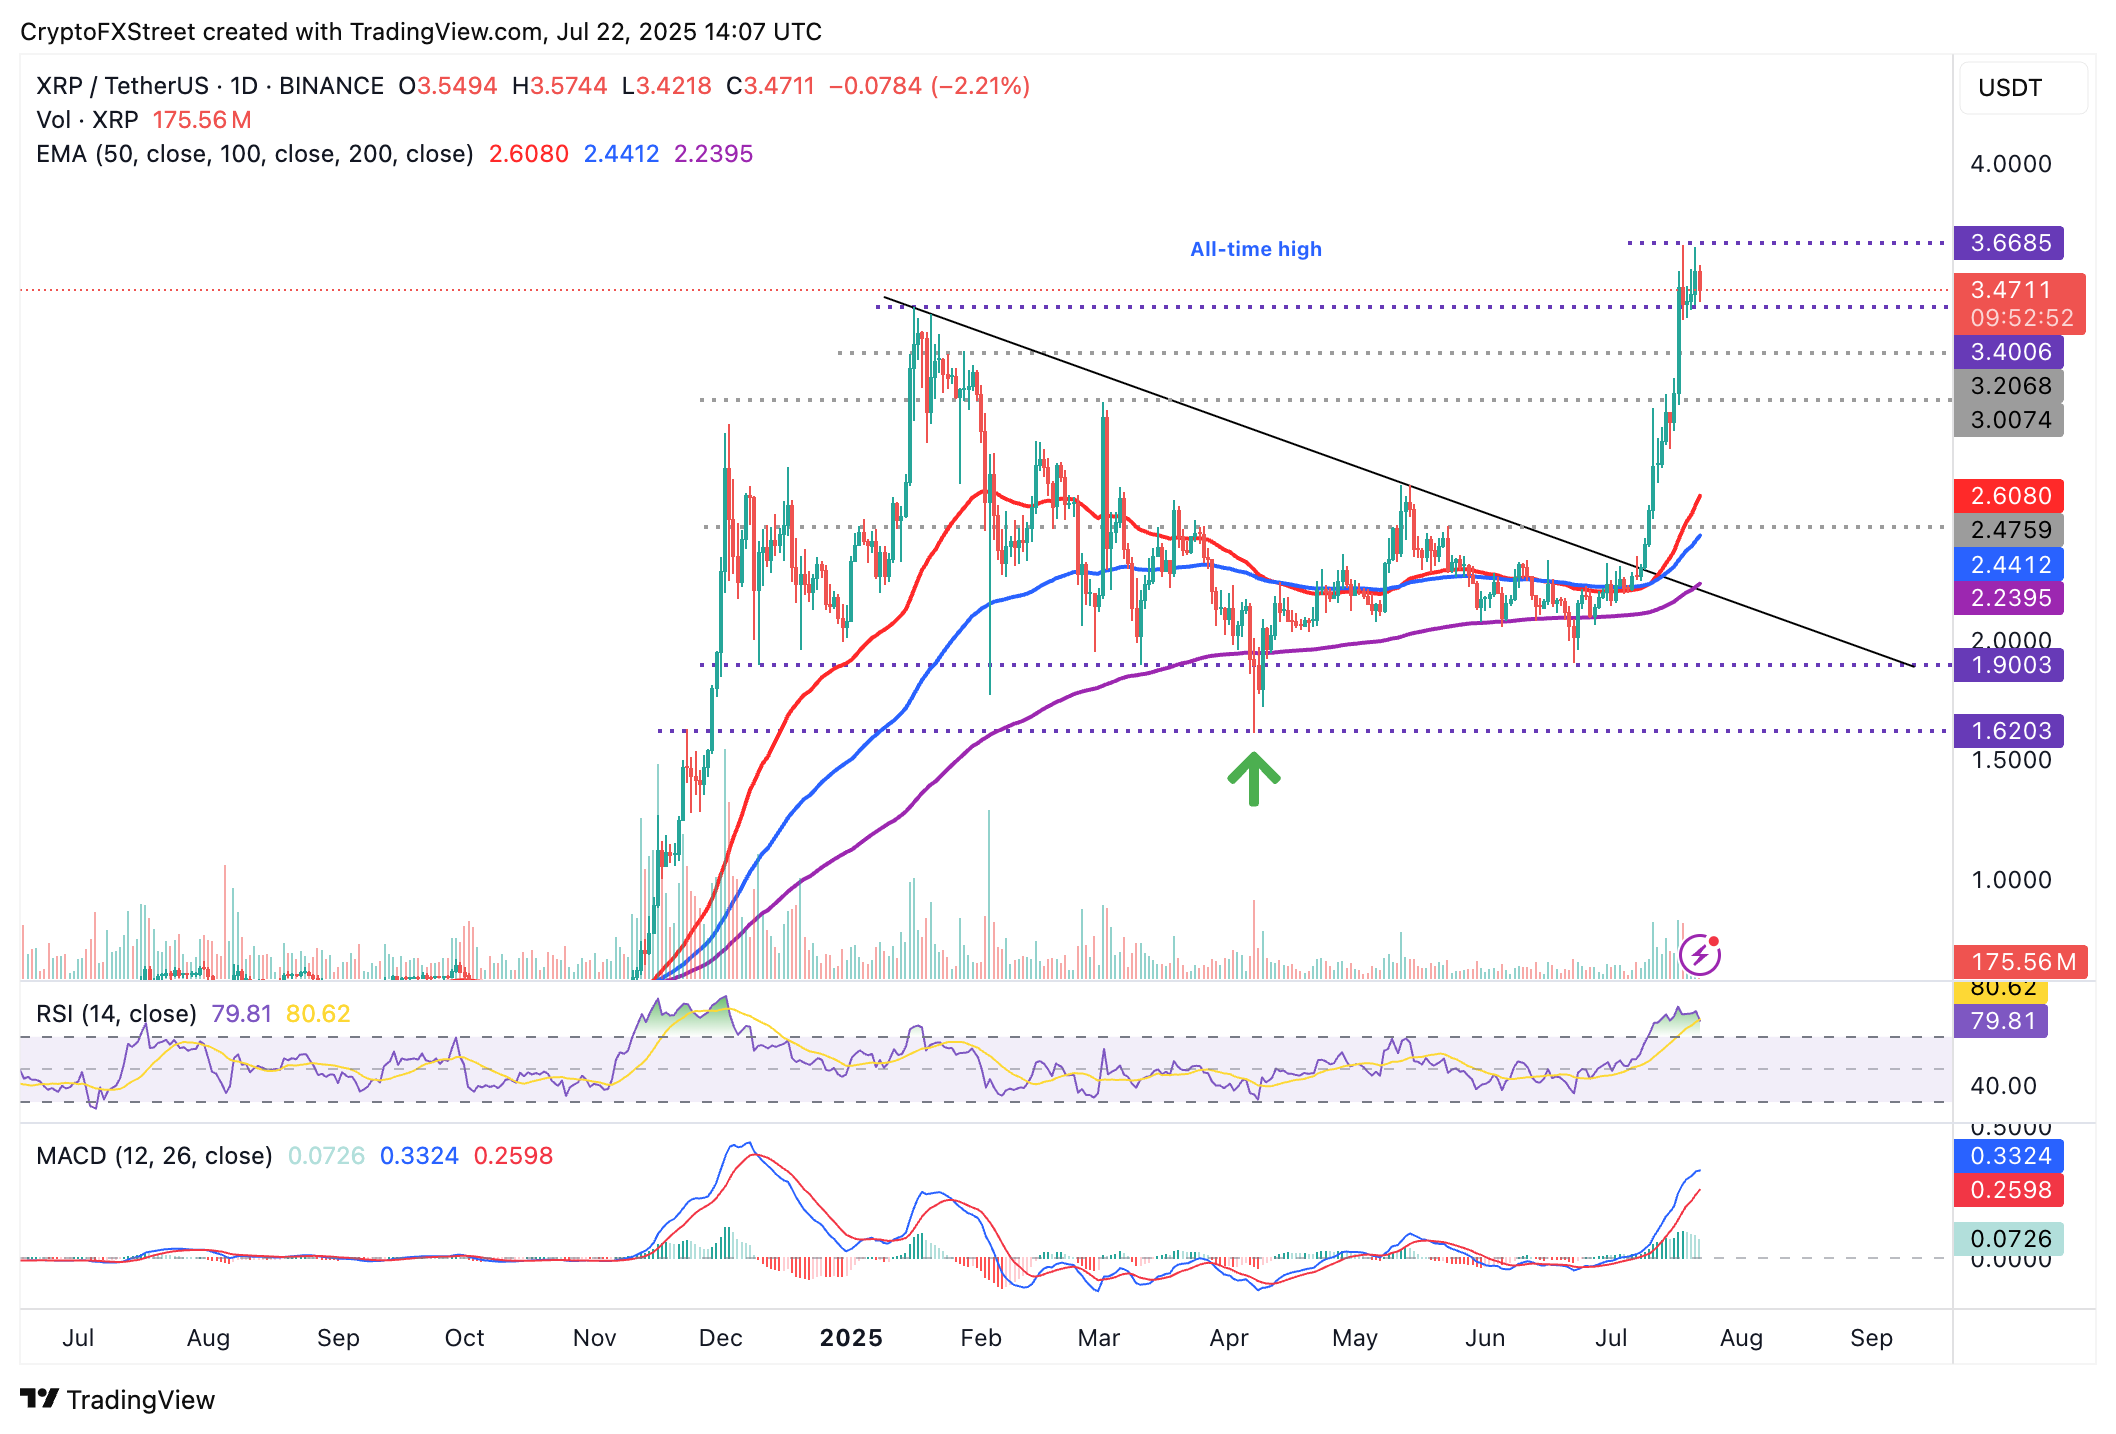
XRP/USDT daily chart
Despite the short-term bearish outlook, the upward-facing moving averages in the daily time frame reinforce the bullish grip. Additionally, a Golden Cross pattern, triggered on July 13 when the 50-day EMA crossed above the 100-day EMA, suggests price momentum has shifted upward and is strengthening market sentiment. This shows that XRP still has the potential to reach higher levels despite short-term hurdles.
Open Interest, funding rate FAQs
Higher Open Interest is associated with higher liquidity and new capital inflow to the market. This is considered the equivalent of increase in efficiency and the ongoing trend continues. When Open Interest decreases, it is considered a sign of liquidation in the market, investors are leaving and the overall demand for an asset is on a decline, fueling a bearish sentiment among investors.
Funding fees bridge the difference between spot prices and prices of futures contracts of an asset by increasing liquidation risks faced by traders. A consistently high and positive funding rate implies there is a bullish sentiment among market participants and there is an expectation of a price hike. A consistently negative funding rate for an asset implies a bearish sentiment, indicating that traders expect the cryptocurrency’s price to fall and a bearish trend reversal is likely to occur.
Recommended Articles


