
Bitcoin Price Forecast: BTC edges below $117,000 ahead of US CPI data
- Bitcoin price declines over 2% on Tuesday after reaching a new all-time high of $123,218 the previous day.
- Data shows that BTC holders and dormant wallets are transferring BTC to exchanges, increasing selling pressure.
- Market participants take a cautious stance ahead of the US CPI data release.
Bitcoin (BTC) price is facing a correction, trading below $117,000 at the time of writing on Tuesday after hitting a new all-time high of $123,218 the previous day. The pullback comes as on-chain data shows increased selling pressure, with both long-term holders and dormant wallets moving BTC to exchanges. Market participants are taking a cautious stance ahead of the US Consumer Price Index (CPI) data release for June, as it could influence the Federal Reserve’s (Fed) interest rate cut decision and bring volatility and direction to riskier assets, such as Bitcoin.
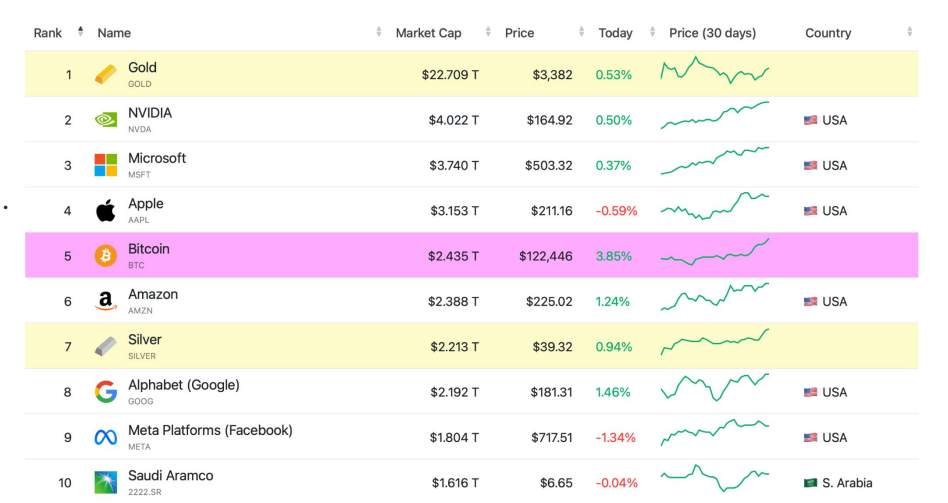
Bitcoin price reaching record highs, surpassing both silver and Amazon in market capitalization
Bitcoin price soared to a new all-time high of $123,218 at the start of this week on Monday. This surge in BTC price flipped its market capitalization to $2.38 trillion, reaching the fifth-largest asset in the world and surpassing both silver and Amazon in terms of market valuation.
Deutsche Bank Research reports on Tuesday that BTC hit record levels in anticipation of the beginning of the White House’s “Crypto Week,” where the House of Representatives is set to vote on a market structure bill (CLARITY Act), a stablecoin bill (GENIUS Act ), and a bill banning a US central bank digital currency (Anti-CBDC Surveillance State Act).
Despite its price rally, BTC’s volatility is at historic lows, suggesting a maturing asset class. This suggests a gradual decoupling of Bitcoin’s price from extreme volatility as increasing market adoption, regulatory clarity, and institutional participation continue to stabilize Bitcoin’s performance over the long term.
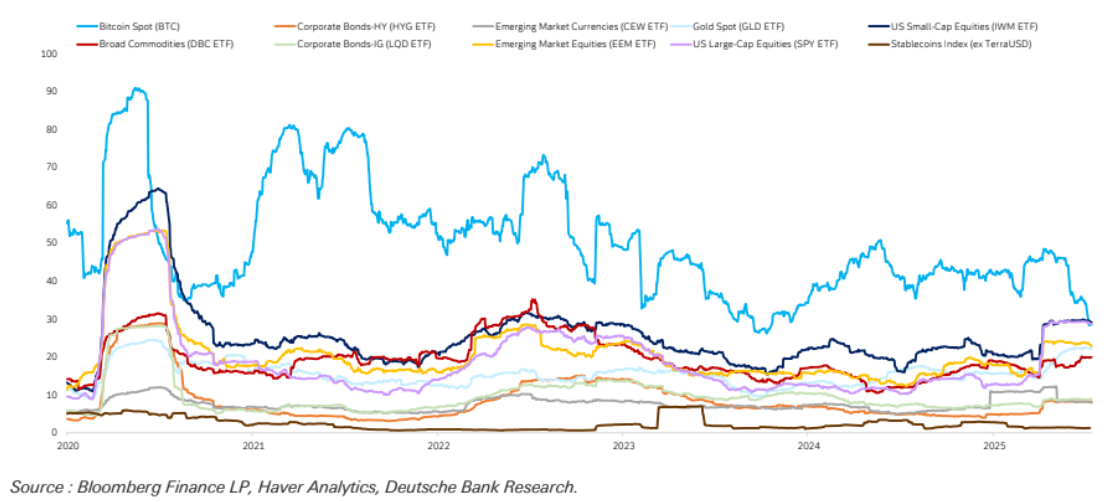
BTC 90-day volatility chart. Source: Deutsche Bank Research
In an exclusive interview with FXStreet, James Toledano, COO of Unity Wallet, said, “Bitcoin seems to be defying economic gravity, perhaps because it was built too.”
Toledano continued that BTC still has juice in its tank, and the US remains the primary engine behind this run. Bipartisan support, ETF inflows, increasing institutional adoption, and expectations of a Fed rate cut are all aligning in Bitcoin’s favor.
Traders take a cautious stance ahead of the US CPI data release
FXStreet reports on Tuesday that inflation in the US is expected to rise at an annual rate of 2.7% in June, having recorded a 2.4% increase in May, and core CPI, which excludes food and energy, is forecast to rise 3% YoY compared to the 2.8% acceleration reported in the previous month. Overall, inflation is expected to tick up further away from the Fed’s 2% target.
This increase is being partly driven by new tariffs imposed by US President Donald Trump, which are beginning to push up the cost of goods.
If the CPI reading comes in higher than expected, it could strengthen the US Dollar (USD), reduce risk appetite, and pressure cryptos. Conversely, if inflation data came in softer than expected, markets may regain confidence in interest rate cuts by the Federal Reserve, which could support risk-on sentiment and riskier assets, such as cryptocurrencies.
BTC holders and dormant wallets book profits at record highs
Bitcoin price dips by over 2% during the European trading session on Tuesday, reaching a low of $116,250. This correction follows a strong rally in the BTC last week as investors begin to realize profit and increase selling pressure.
CryptoQuant data indicate that BTC’s Exchange Netflow (the difference between BTC flowing into and out of the exchange) is positive, currently at 23,075 BTC, reaching levels not seen since July 16, 2024.
Historically, when netflow shows a massive spike, BTC prices have fallen sharply as investors are likely sending BTC to sell, which could contribute to the short-term pullback.
 - All Exchanges (6)-1752576995442.png)
Additionally, Lookonchain data also supports a bearish outlook. It shows that BTC’s dormant wallet holding 80,009 BTC worth $9.46 billion has transferred another 7,843 BTC worth $927 million to Galaxy Digital, making a total transfer of 16,843 BTC, nearly $2 billion. Galaxy Digital is depositing BTC to exchanges, with 2,000 BTC worth $236 million directly deposited to Bybit and Binance exchanges on Tuesday, increasing the selling pressure.

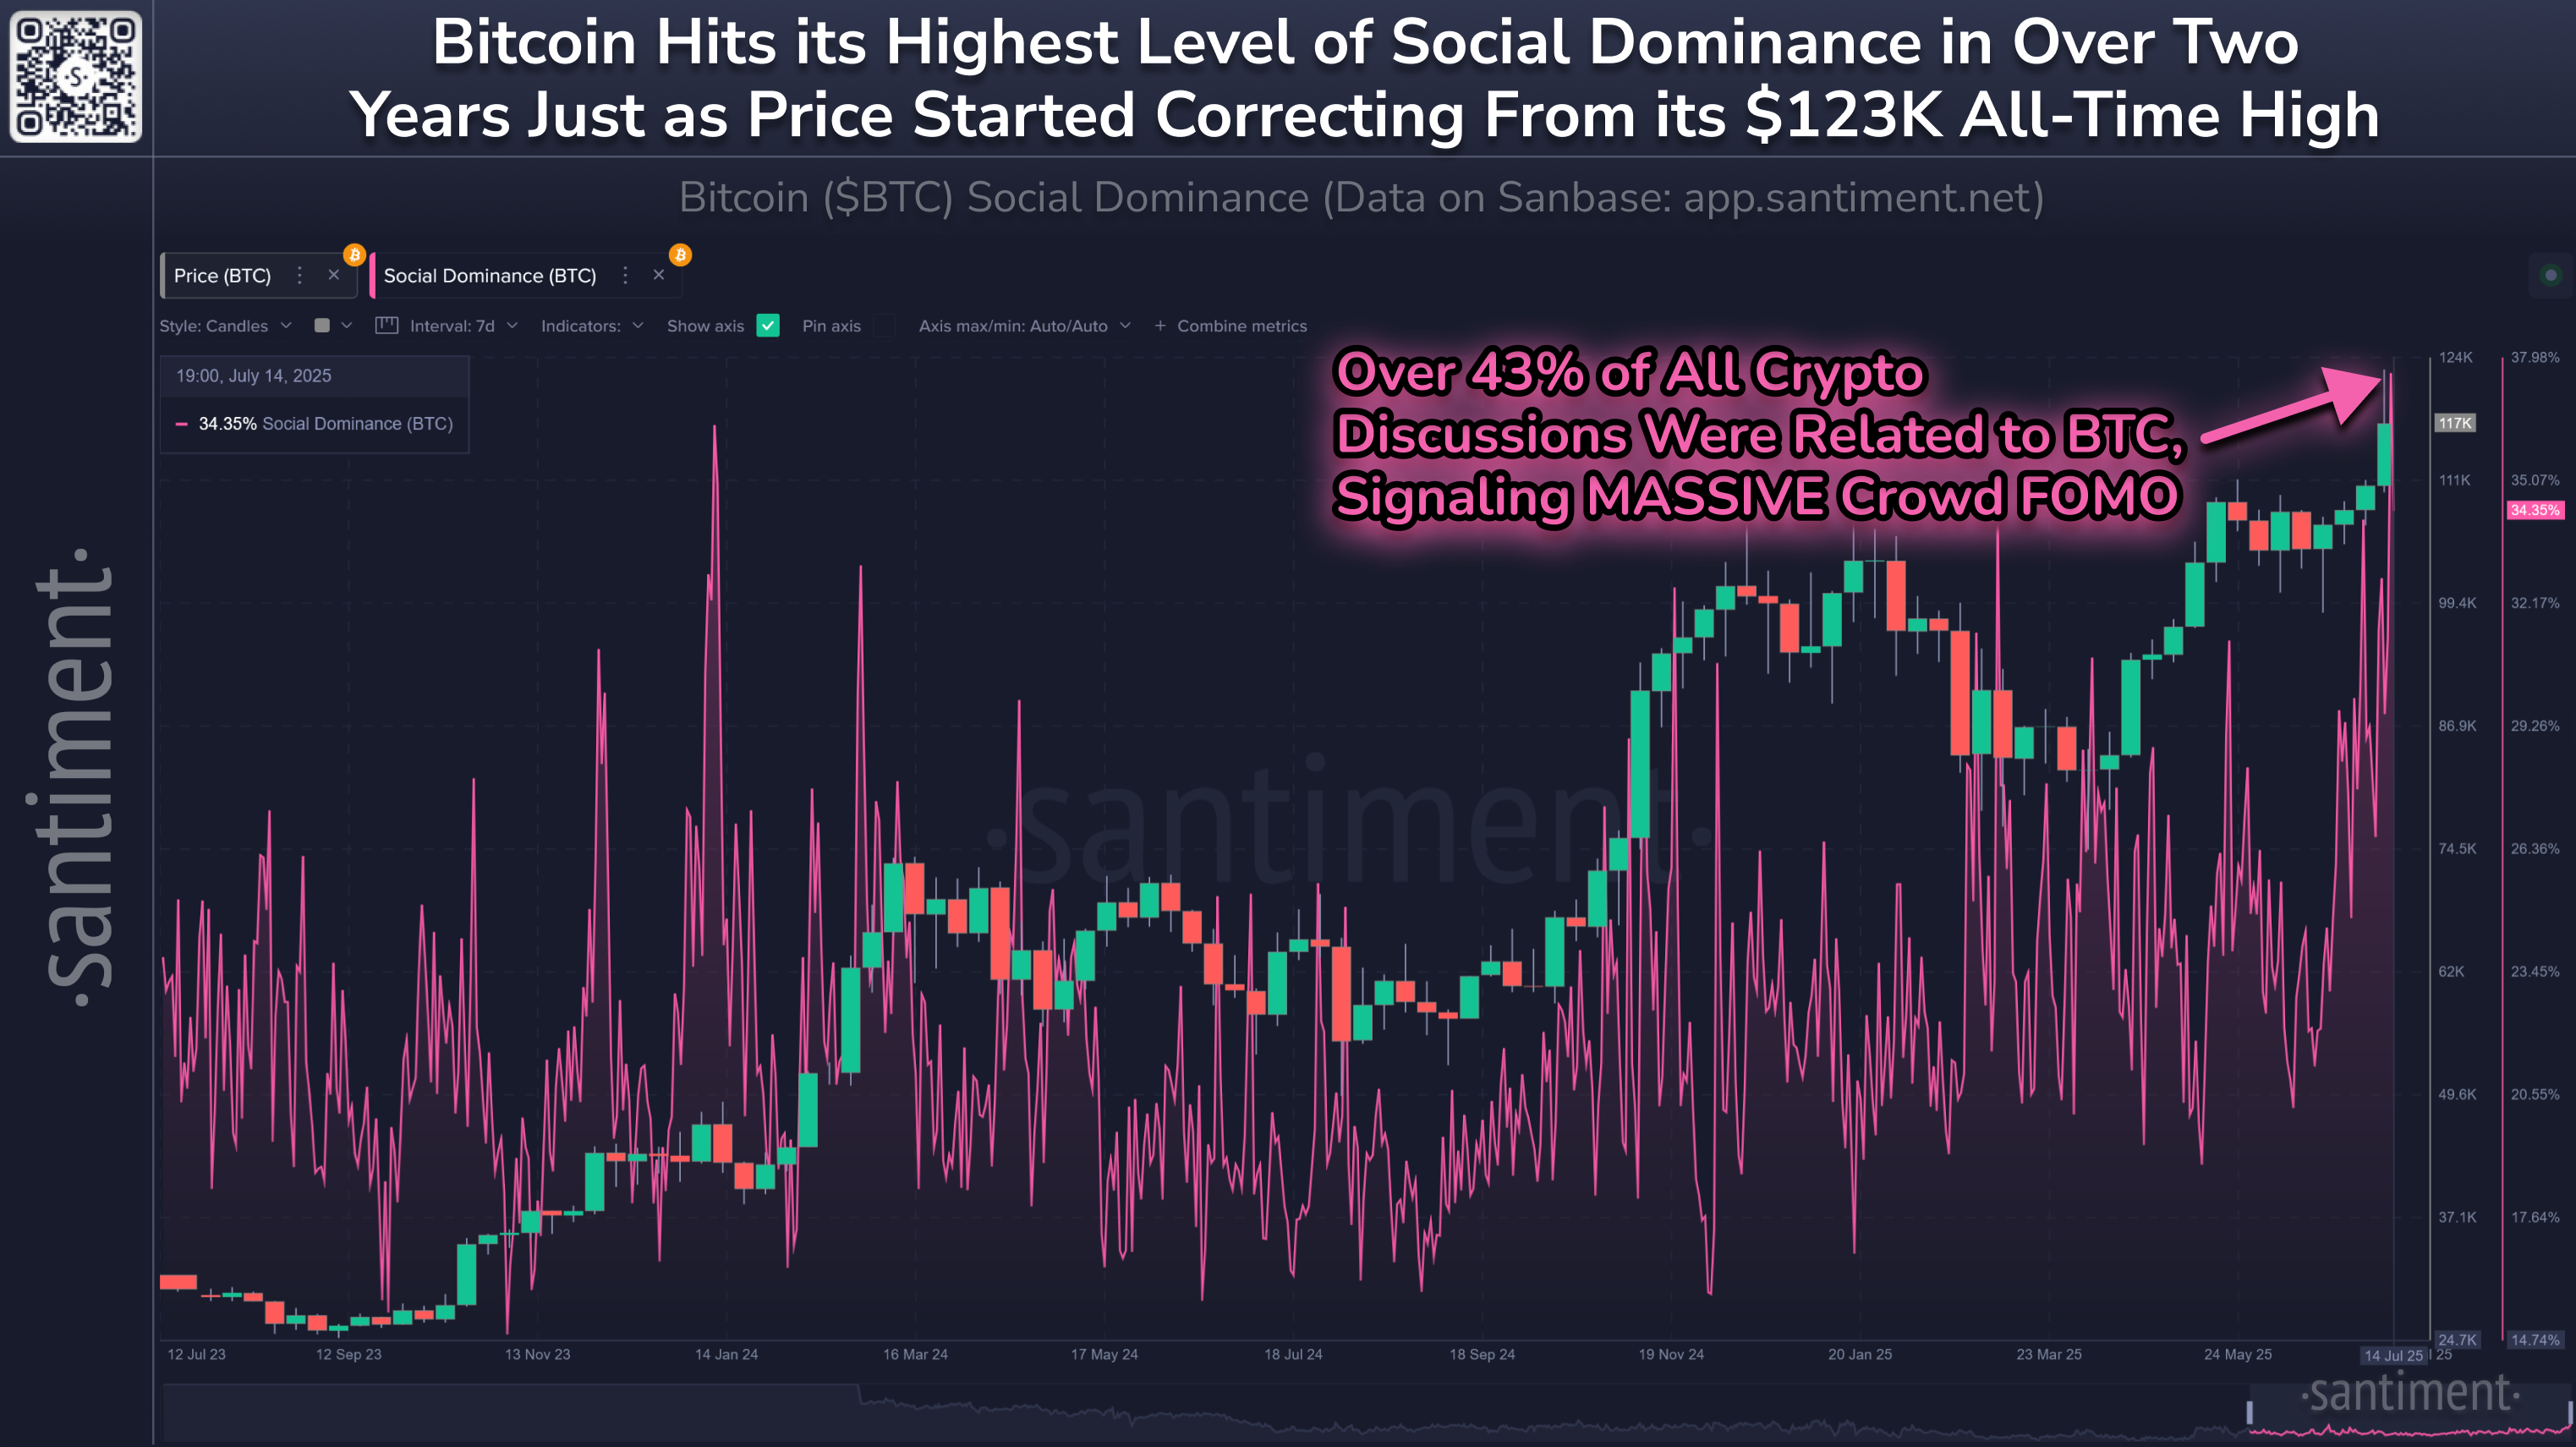
Moreover, Santiment data shows that as BTC reached its record levels on Monday, over 43.06% of all crypto discussions were about BTC in the social dominance index. This sudden spike indicates a growing Fear Of Missing Out (FOMO) among retail traders, which often precedes a short-term price correction before the broader uptrend resumes.
Bitcoin Price Forecast: BTC dips after reaching record highs
Bitcoin price rallied, reaching a new all-time high of $123,218 on Monday, but failed to close above the psychological level of $120,000. At the time of writing on Tuesday, it dips by 2.35%, trading below $107,000.
If BTC continues to face a correction, it could extend the decline to the prior all-time high of $111,980 set on May 22.
The Relative Strength Index (RSI) indicator on the daily chart reads 65, pointing downward after being rejected from overbought conditions on Monday, indicating fading bullish momentum. Moreover, if the RSI continues to decline and closes below its neutral level of 50, BTC could fall sharply.
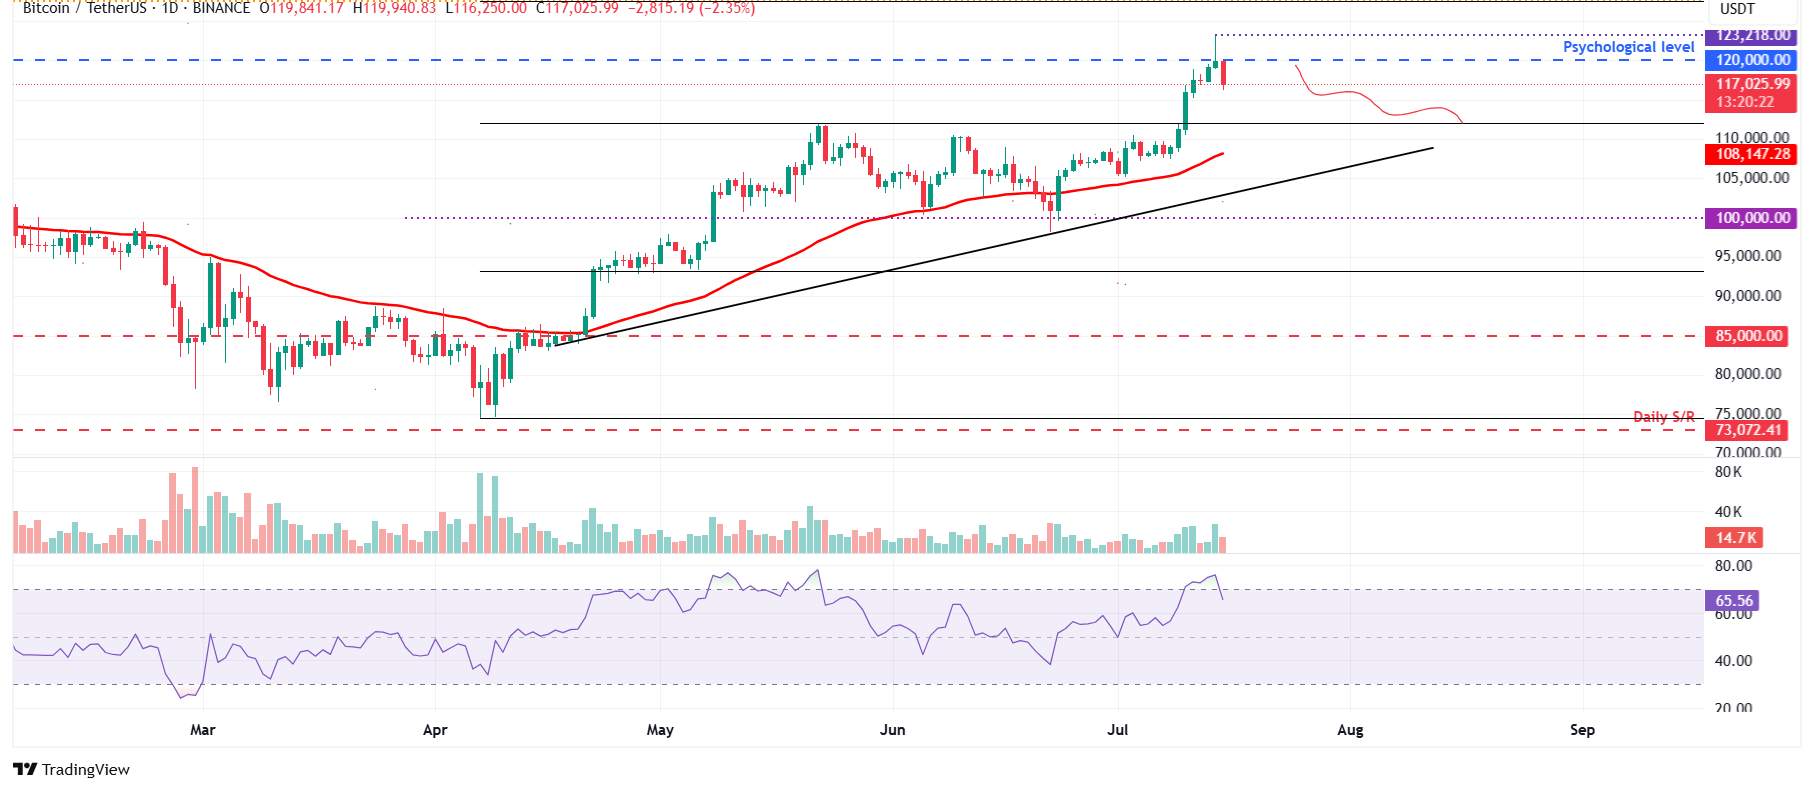
BTC/USDT daily chart
On the other hand, if BTC recovers and closes above the $120,000 level on a daily basis, it could extend the recovery toward the fresh all-time high at $123,218 and beyond.
Recommended Articles


