


Bonk discontinues redemption for Solana Saga owners as claims slow down
- Bonk shows a quick recovery following a bearish start to the week, teases a post-retest reversal from a falling wedge pattern.
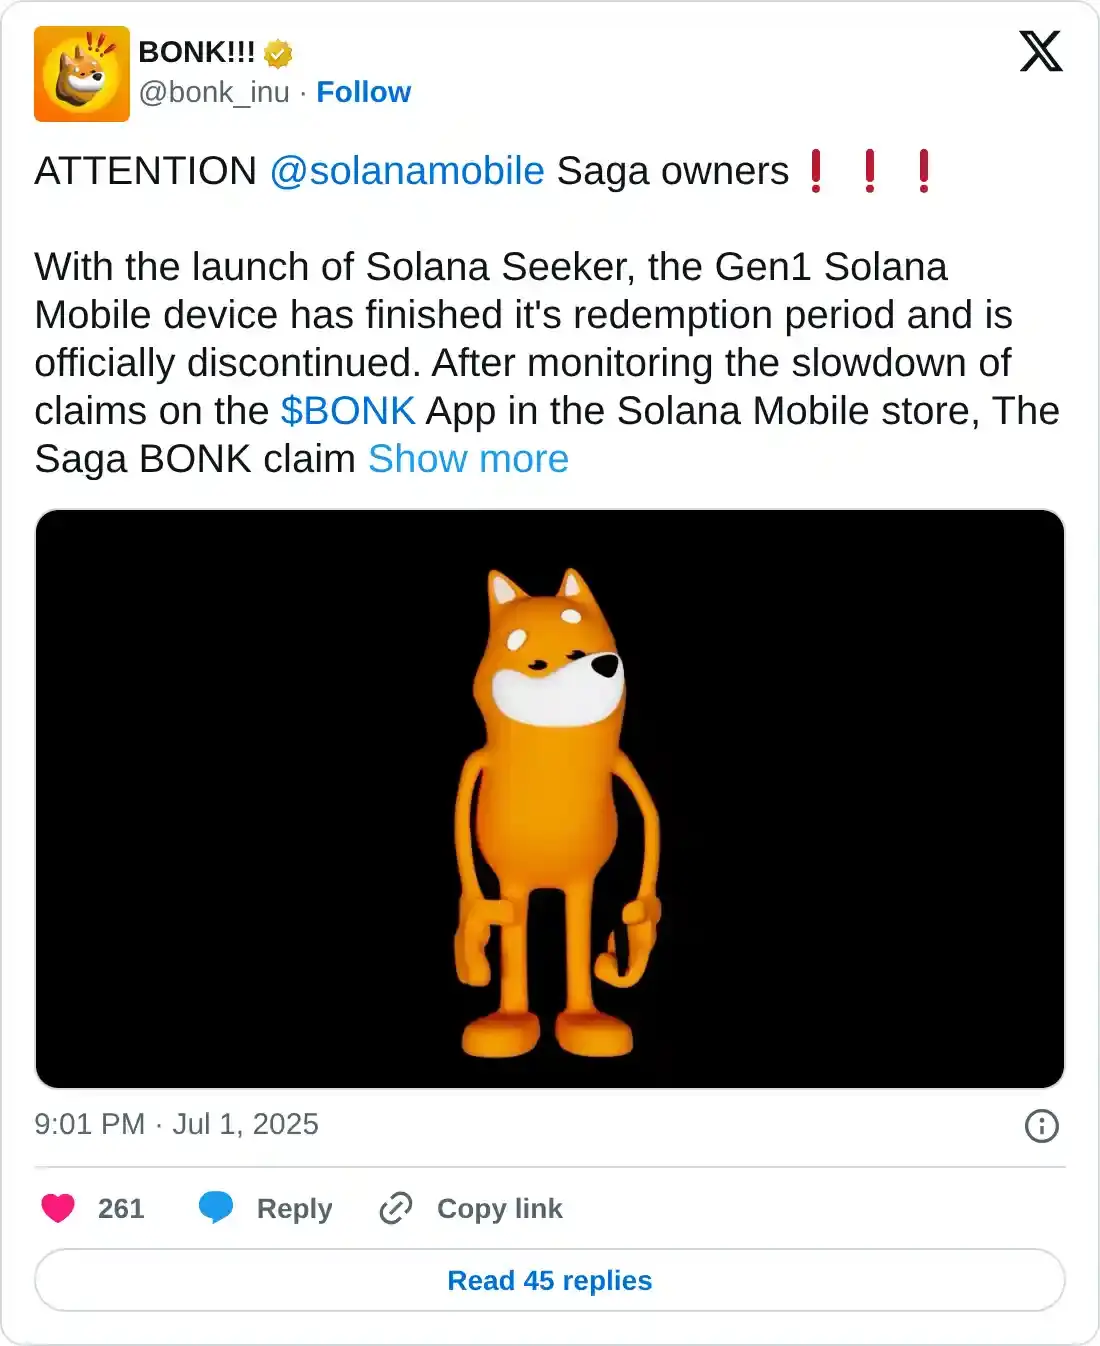
- Bonk announces the discontinuation of token redemption for Solana Saga phone owners from July 31.
- The BONK Open Interest jumps in the last 24 hours as intraday recovery sparks optimism.
Bonk (BONK) recovers by almost 4% at press time on Wednesday following two consecutive days of losses. Both the announcement of BONK redemption suspension for Saga users from July 31 and the surge in Open Interest align with the minor recovery, signaling upside potential in the token's price.
Bonk suspends redemption on Solana’s Saga mobile device
In a recent tweet on Wednesday, Bonk announced the suspension of its native token on Solana’s Saga, as the claims rate drops on the Solana Mobile store. The launch of the new Solana Seeker mobile device marks the end of the Gen-1 mobile device redemption period and will be officially discontinued.
With 17,599 claims made out of the 20,000 total claims, the unclaimed BONK is to be transferred to Bonk’s Decentralized Autonomous Organization (DAO) on July 31.
Optimism sparks in BONK derivatives
Coinglass’ data shows a 4.18% surge in Open Interest (OI) in the last 24 hours, reaching $11.77 million. Investors could consider this a sign of increased optimism, as increased buying activity fuels the OI.
Adding credence to increased buying, the OI-weighted funding rate has ticked higher to 0.0022% from 0.0009% over the last 8 hours. Typically, positive funding rates are imposed on bulls to offset the imbalance in spot and swap prices resulting from heightened buying.
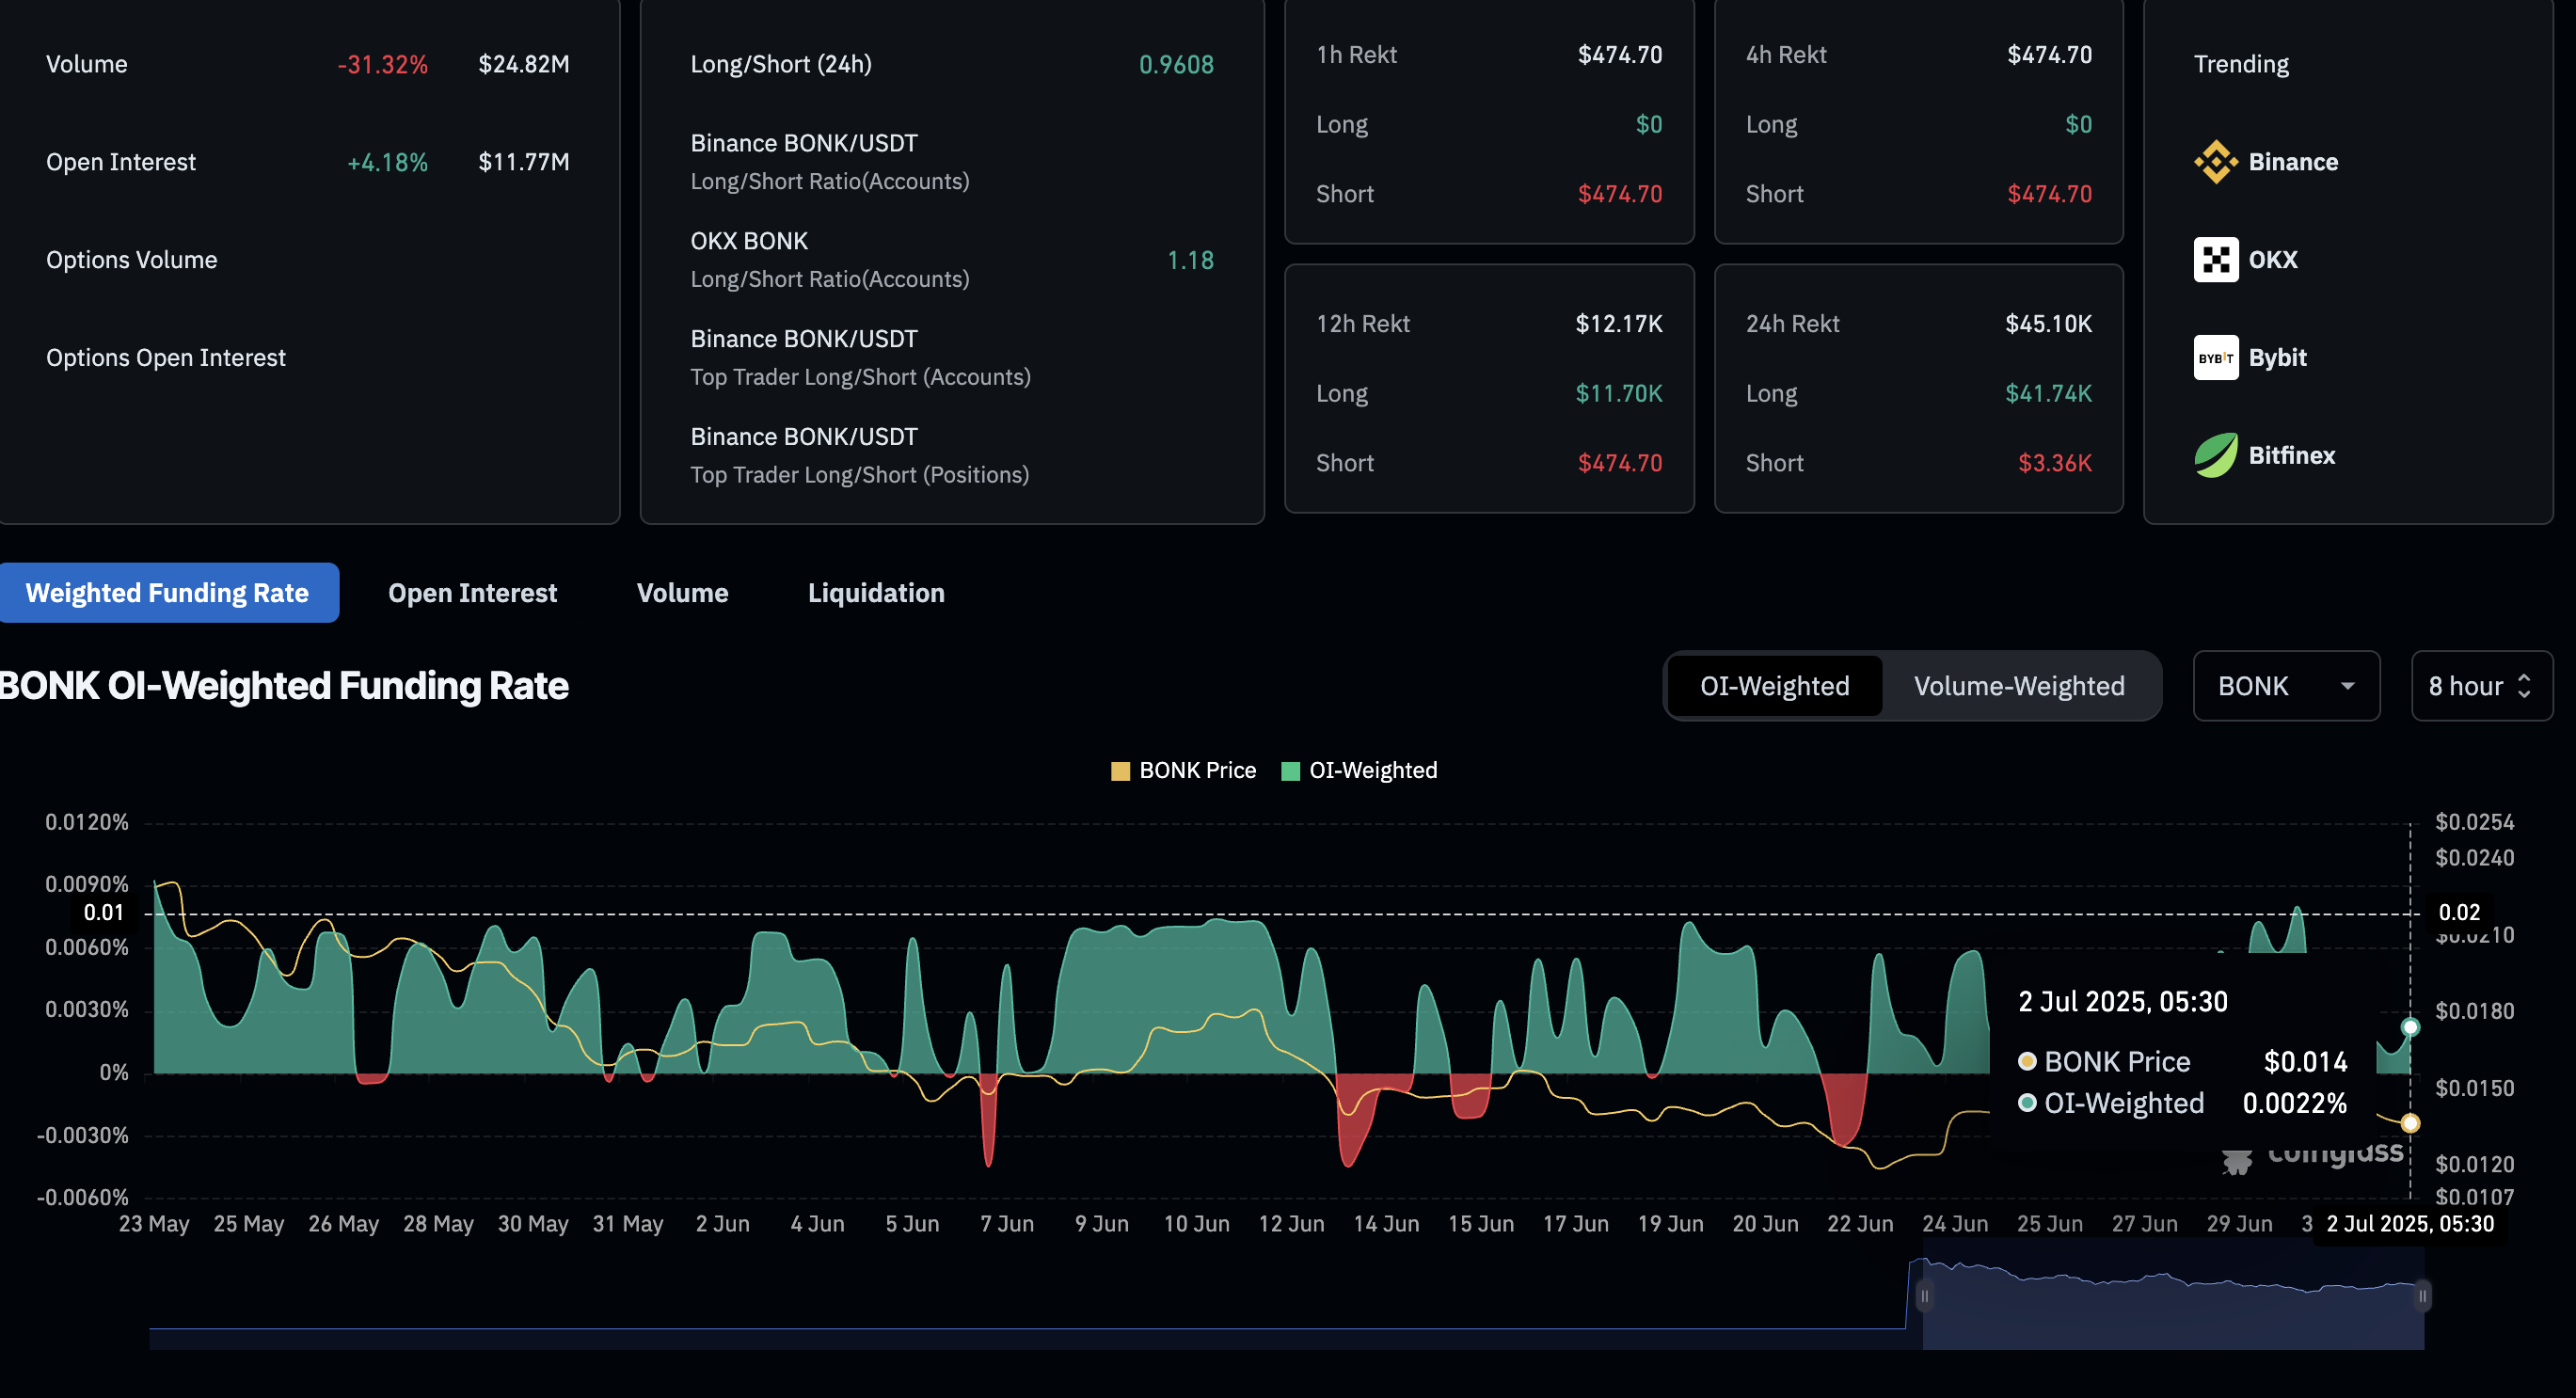
BONK derivatives. Source: Coinglass
BONK eyes further gains with a post-retest reversal
Bonk edges higher by almost 4% at press time on Wednesday, pulsing closer to mark the first bullish candle this week. The meme coin hovers above a broken resistance trendline, suggesting a potential post-retest bounce back.
Price action displayed a falling wedge pattern on the daily chart, with converging resistance (connected by the May 12 and June 11 peaks) and a support trendline (connected by the May 17, May 31, and June 22 lows). Bonk’s 10% surge on Saturday marked the pattern breakout.
As BONK almost retested the area above the broken trendline, the intraday surge hints at a post-retest reversal. A potential positive close to the day could extend the recovery towards the 50% Fibonacci retracement level at $0.00001734, drawn from $0.00000886 on April 7 to $0.00002581 on May 12.
The Moving Average Convergence/Divergence (MACD) indicator displays a positive trend in green histogram bars on the daily chart as the bullish strength holds. However, investors must pay attention to the MACD line moving close to its signal line, which could trigger a sell signal if it marks a crossover.
The Relative Strength Index (RSI) hovers higher at 46, inching closer to the midline, indicating a reduction in bearish pressure.
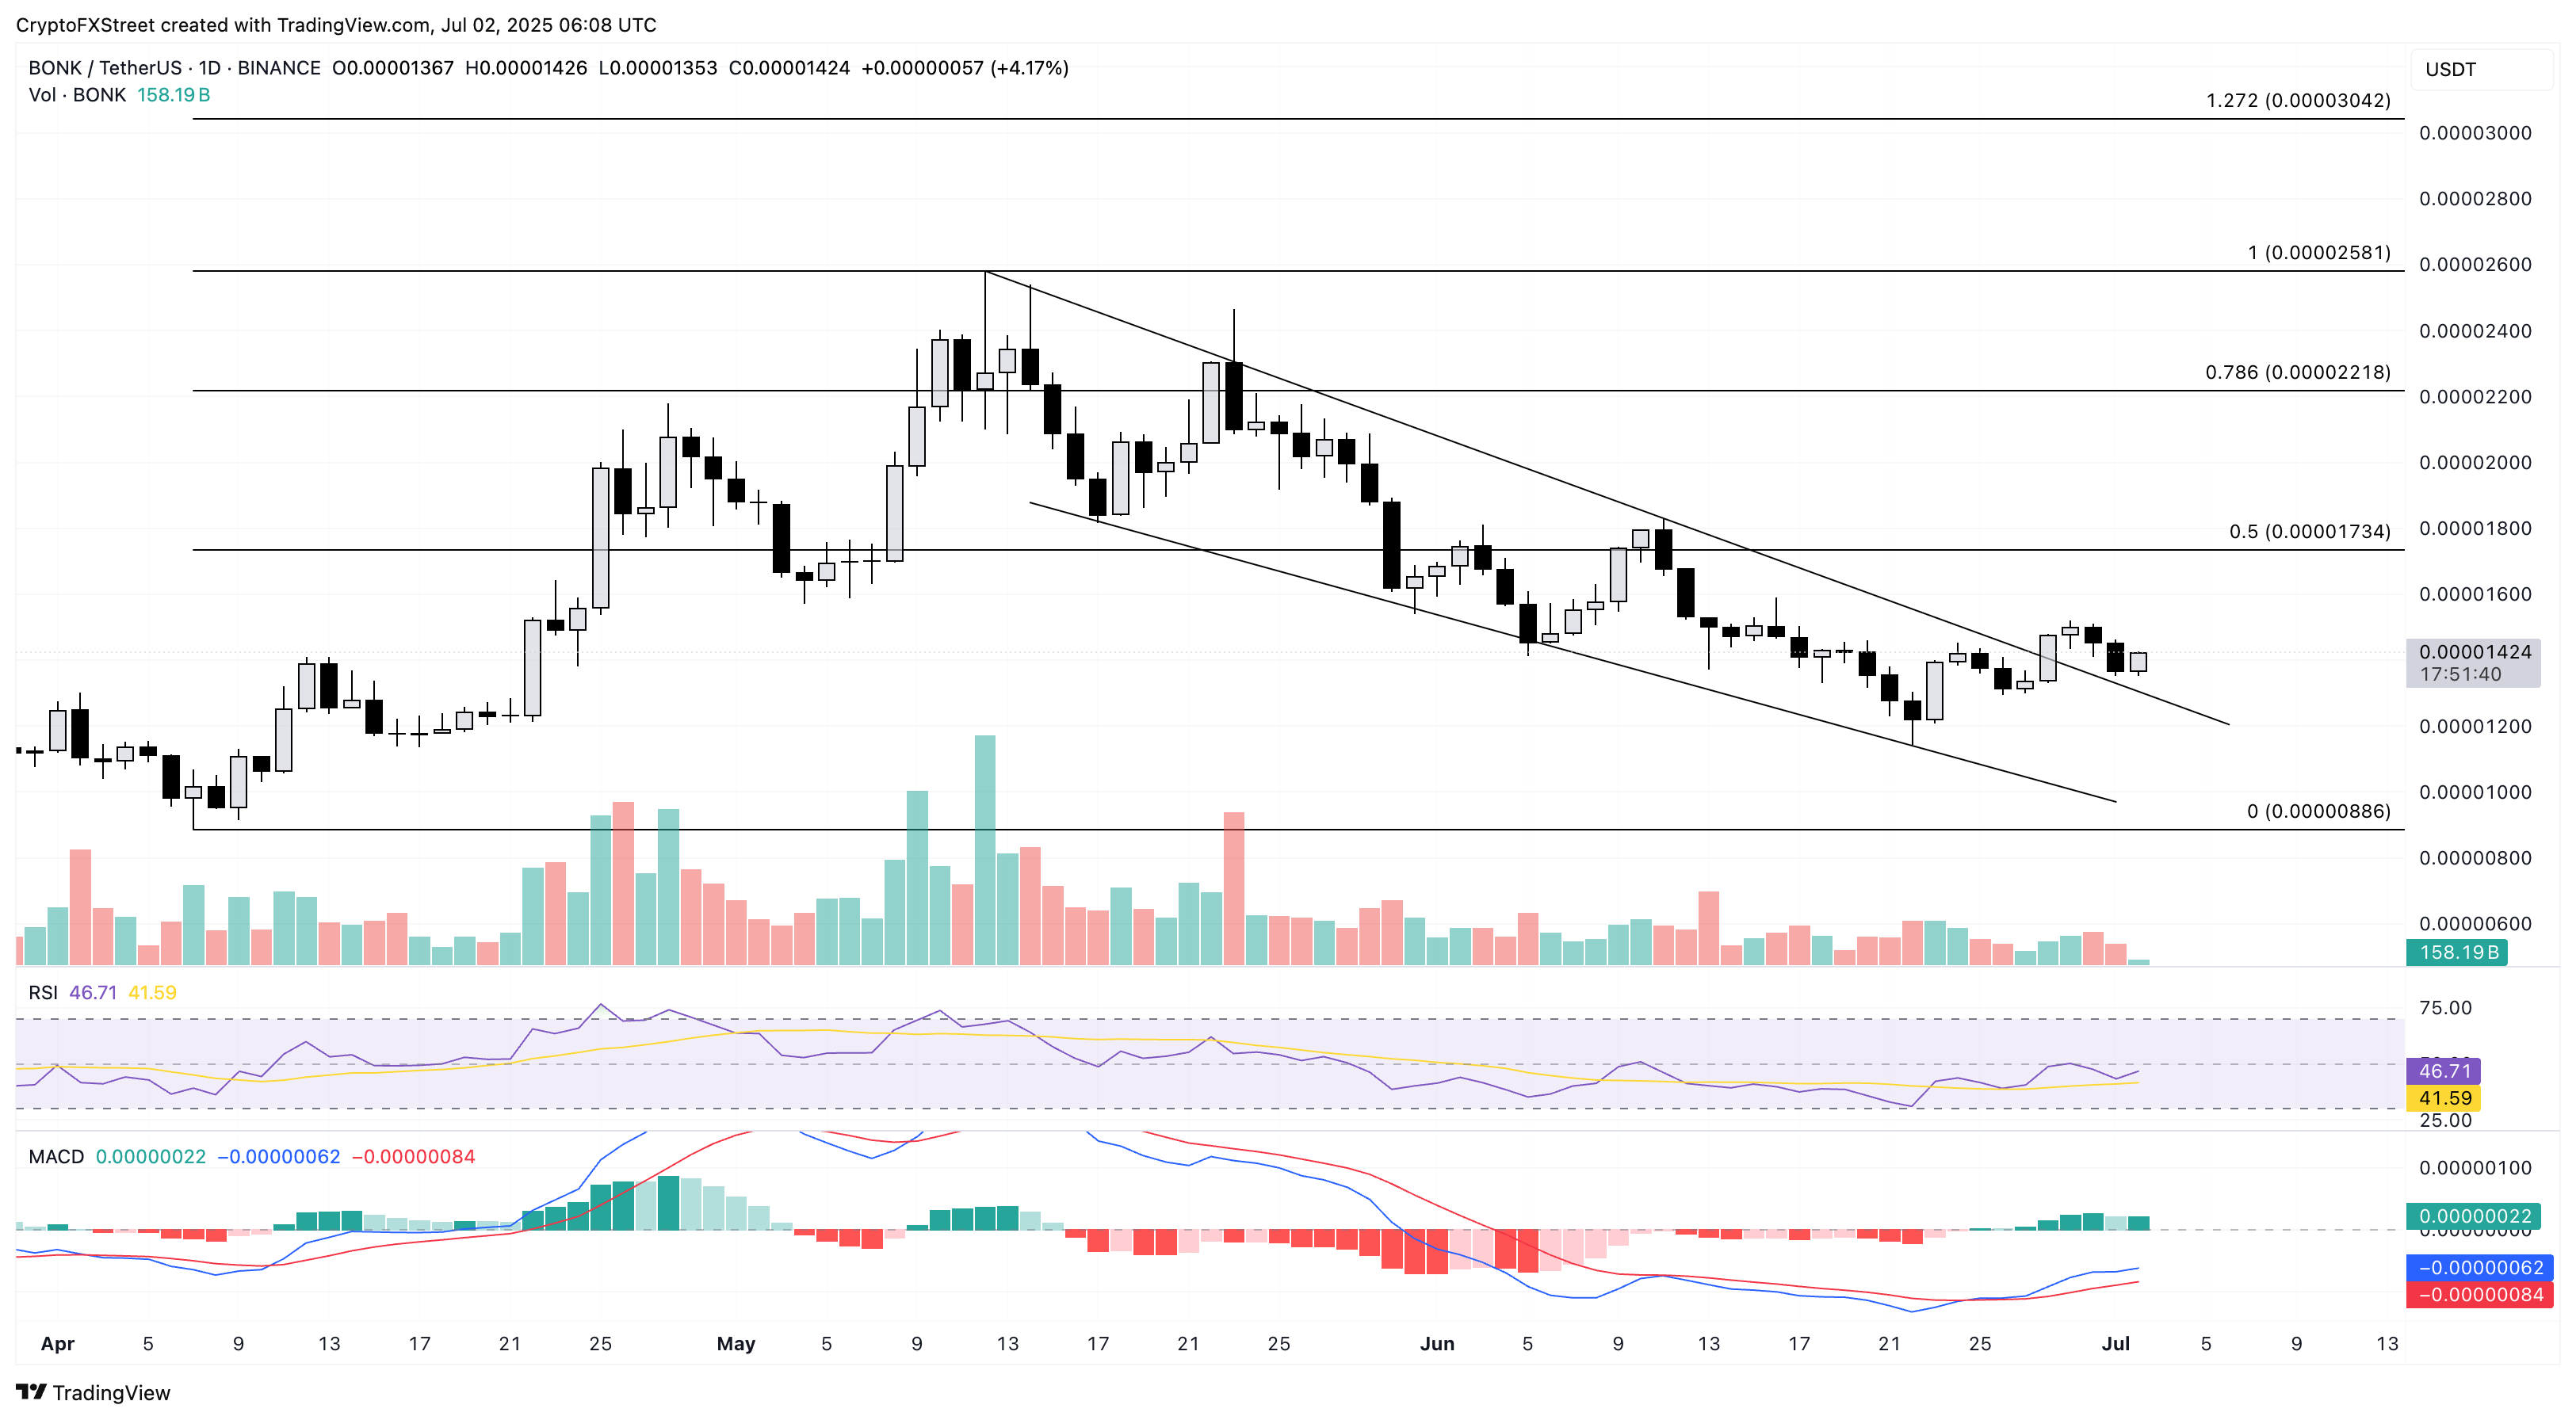
BONK/USDT daily price chart.
If BONK fails to hold a positive close on Wednesday, it could extend towards the Thursday low of $0.00001295.
Recommended Articles


