


Bitcoin Cash Price Forecast: Bullish momentum holds as BCH eyes potential channel breakout
- Bitcoin Cash edges higher towards a rising channel’s upper resistance, teasing a potential breakout.
- On-chain data indicates the BCH recovery run is approaching a high supply area.
- Bitcoin Cash’s Open Interest surges 25% in the last 24 hours, suggesting a sudden rise in optimism.
Bitcoin Cash (BCH) ticks higher by over 3% at press time on Tuesday, marking a bullish start to July. A spike in BCH Open Interest supports the bullish technical outlook, suggesting a potential breakout from a rising channel pattern. However, the on-chain data indicates a high supply zone on the horizon that could hinder the uptrend.
On-chain data warns of a strong supply zone
Intotheblock’s Global In/Out of the Money (GIOM) indicator displays Bitcoin Cash’s “at-the-money” extending from $515 to $550 with a volume of 215K BCH. As the altcoin continues to rise, the immediate high supply zone, with 1.21 million BCH, lies between $550 and $712.
Typically, a recovery to a high supply zone results in a pullback as trapped holders realize profits or close positions at break-even.
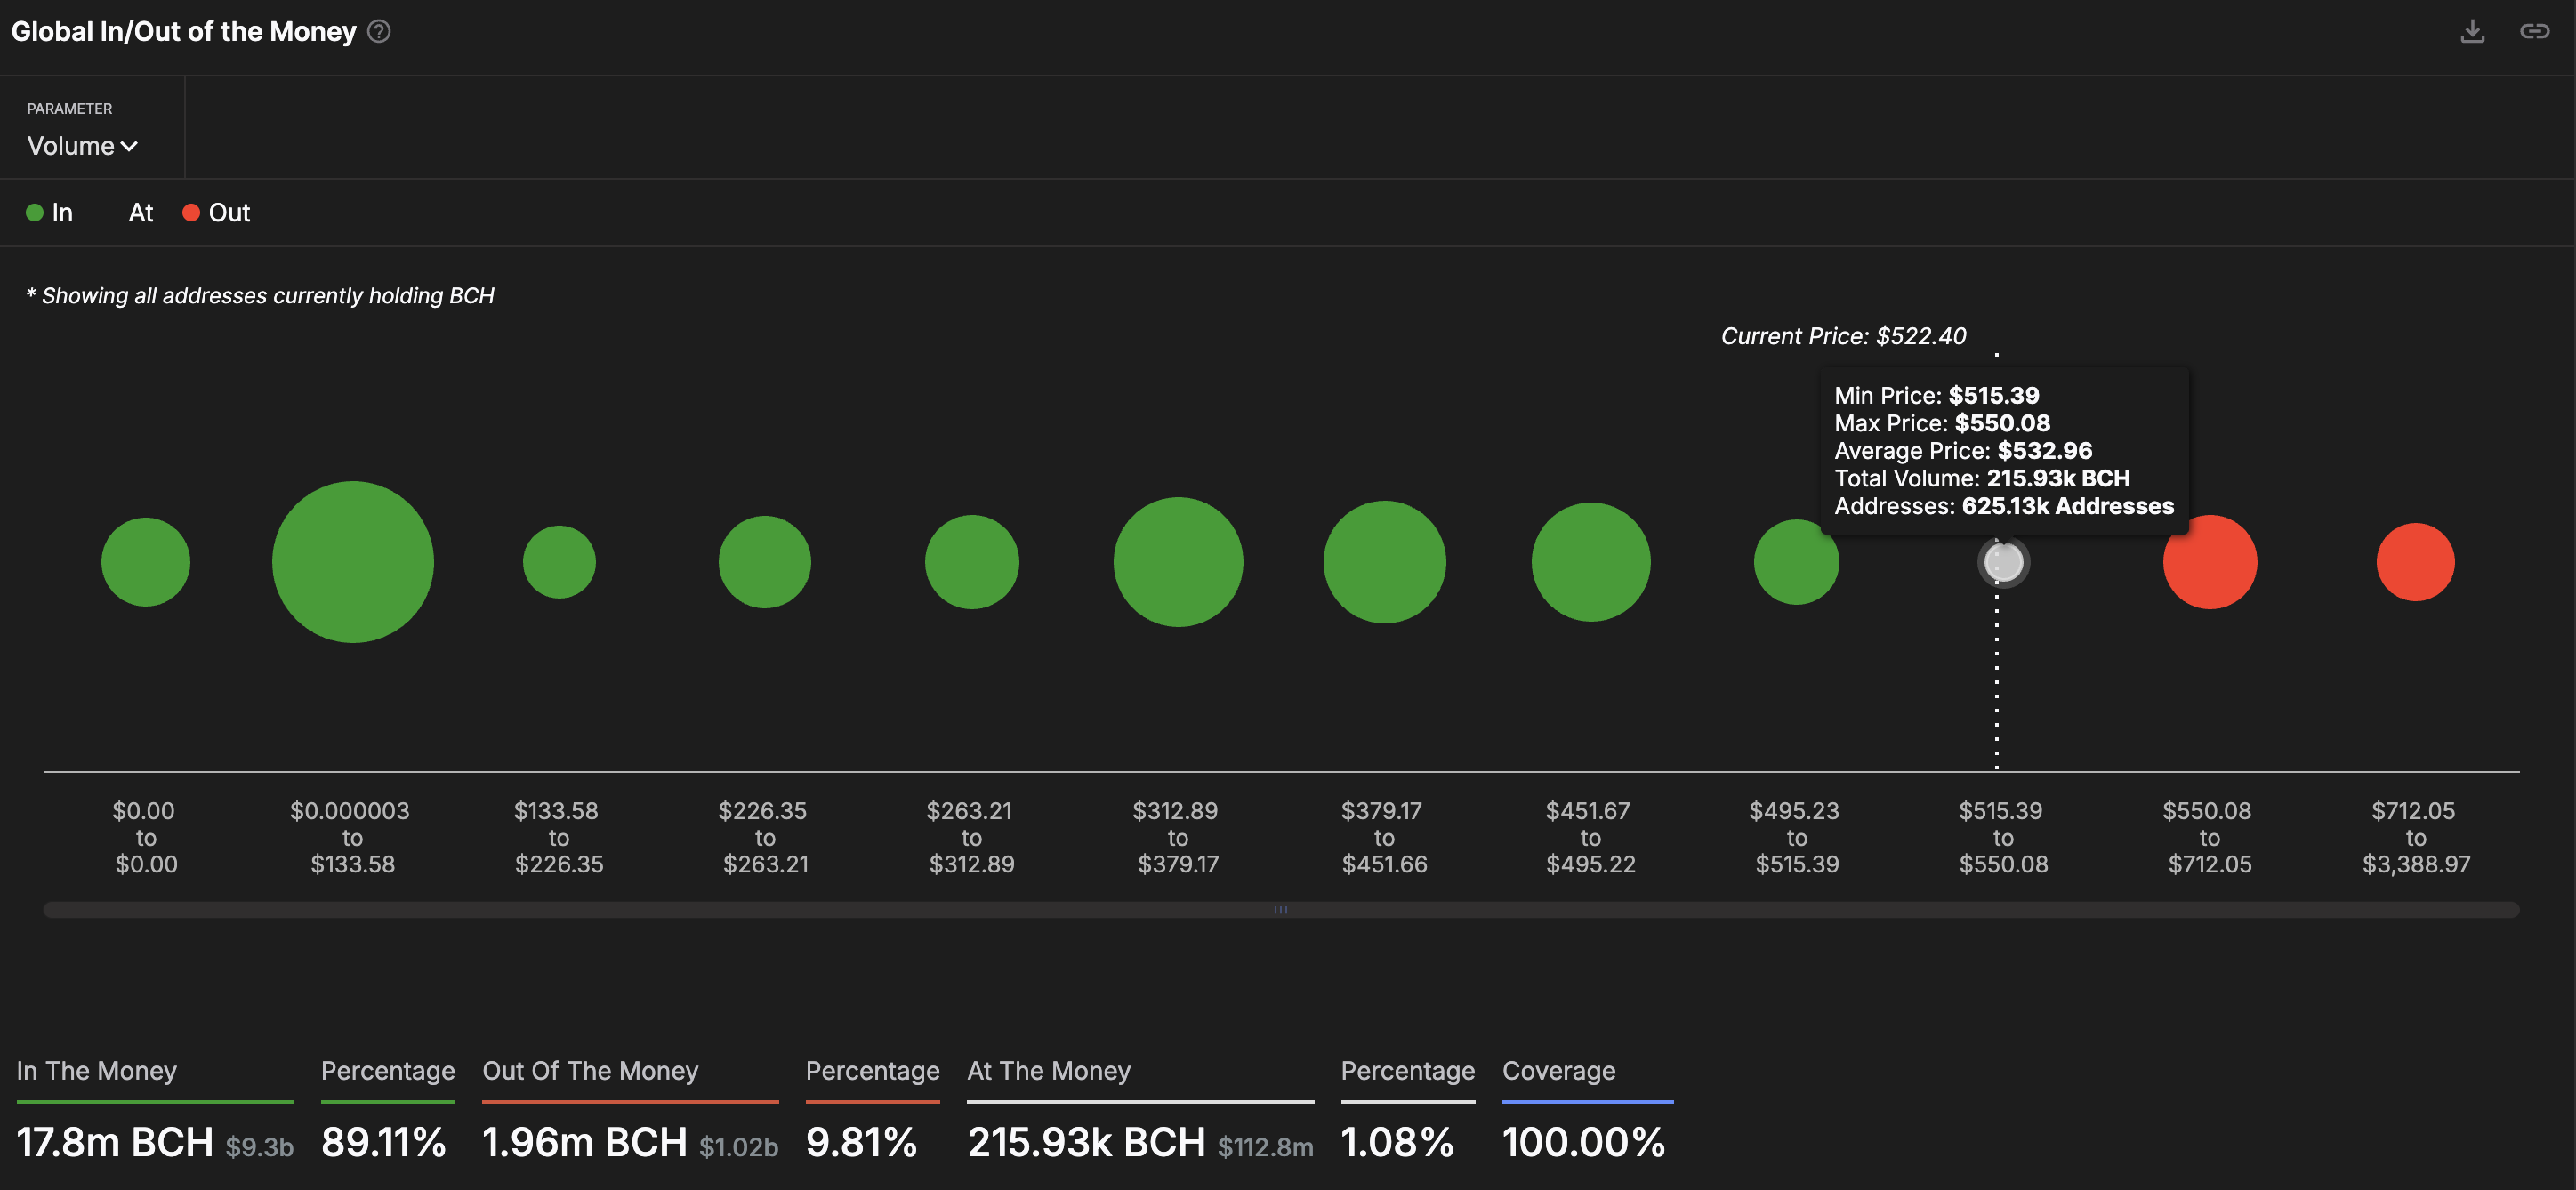
Global In/Out of the Money indicator. Source: Intotheblock
On the other hand, the zone between $495 and $515 holds a volume of 941K BCH that could absorb the incoming supply.
BCH Open Interest surge signals increased optimism
Coinglass’ data indicates that BCH Open Interest (OI) surged by 25% in the last 24 hours, reaching $580 million. An increased buying activity fuels the OI spike, suggesting heightened optimism surrounding Bitcoin Cash.
The data further highlights increased wipeout of bearish-aligned traders as short liquidations in the last 24 hours hit $1.23 million compared to $235.74K in longs. Due to the liquidation imbalance, the long/short ratio rises to 1.0661, indicating a marginally greater number of active bullish positions.
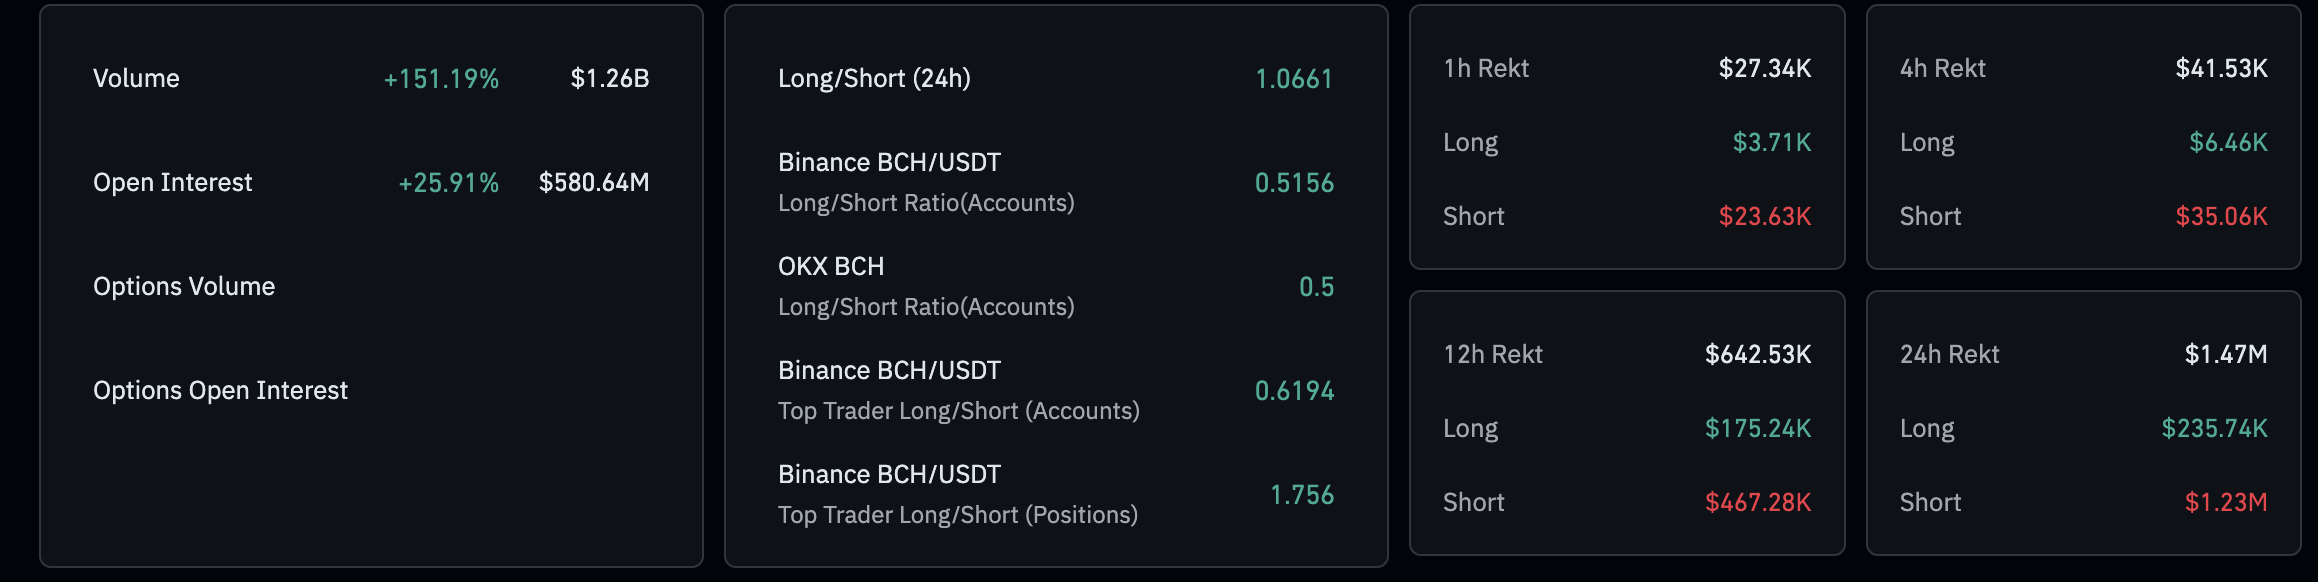
Bitcoin Cash derivatives. Source: Coinglass
Bitcoin Cash nears rising channel breakout
Bitcoin Cash extends its gains by over 3% at press time on Tuesday, maintaining its position above the $500 psychological mark. With a positive start to July, BCH also marks a new year-to-date high at $530.
The recovery in BCH challenges the 78.6% Fibonacci retracement level at $523, drawn from the December 6 high of $640 to the April 7 low of $249. Alongside the Fibonacci level, the altcoin tests a local resistance trendline connected by May 8 and June 19 peaks. It is worth noting that a support trendline formed by the lows of April 16 and May 31 completes a rising channel pattern.
A clean push above the trendline could extend the uptrend towards a local resistance level of $551, which is close to the on-chain resistance of $550. Beyond this level, the December 6 high at $640 is a potential target zone.
The Moving Average Convergence/Divergence (MACD) indicator displays an uptrend in the MACD and signal lines, suggesting a successive rise in bullish momentum. The green histogram bars rising from the zero line add credence to the increased momentum.
Additionally, the Relative Strength Index (RSI) is hovering below the overbought boundary line at 67, pointing higher, suggesting heightened buying pressure.
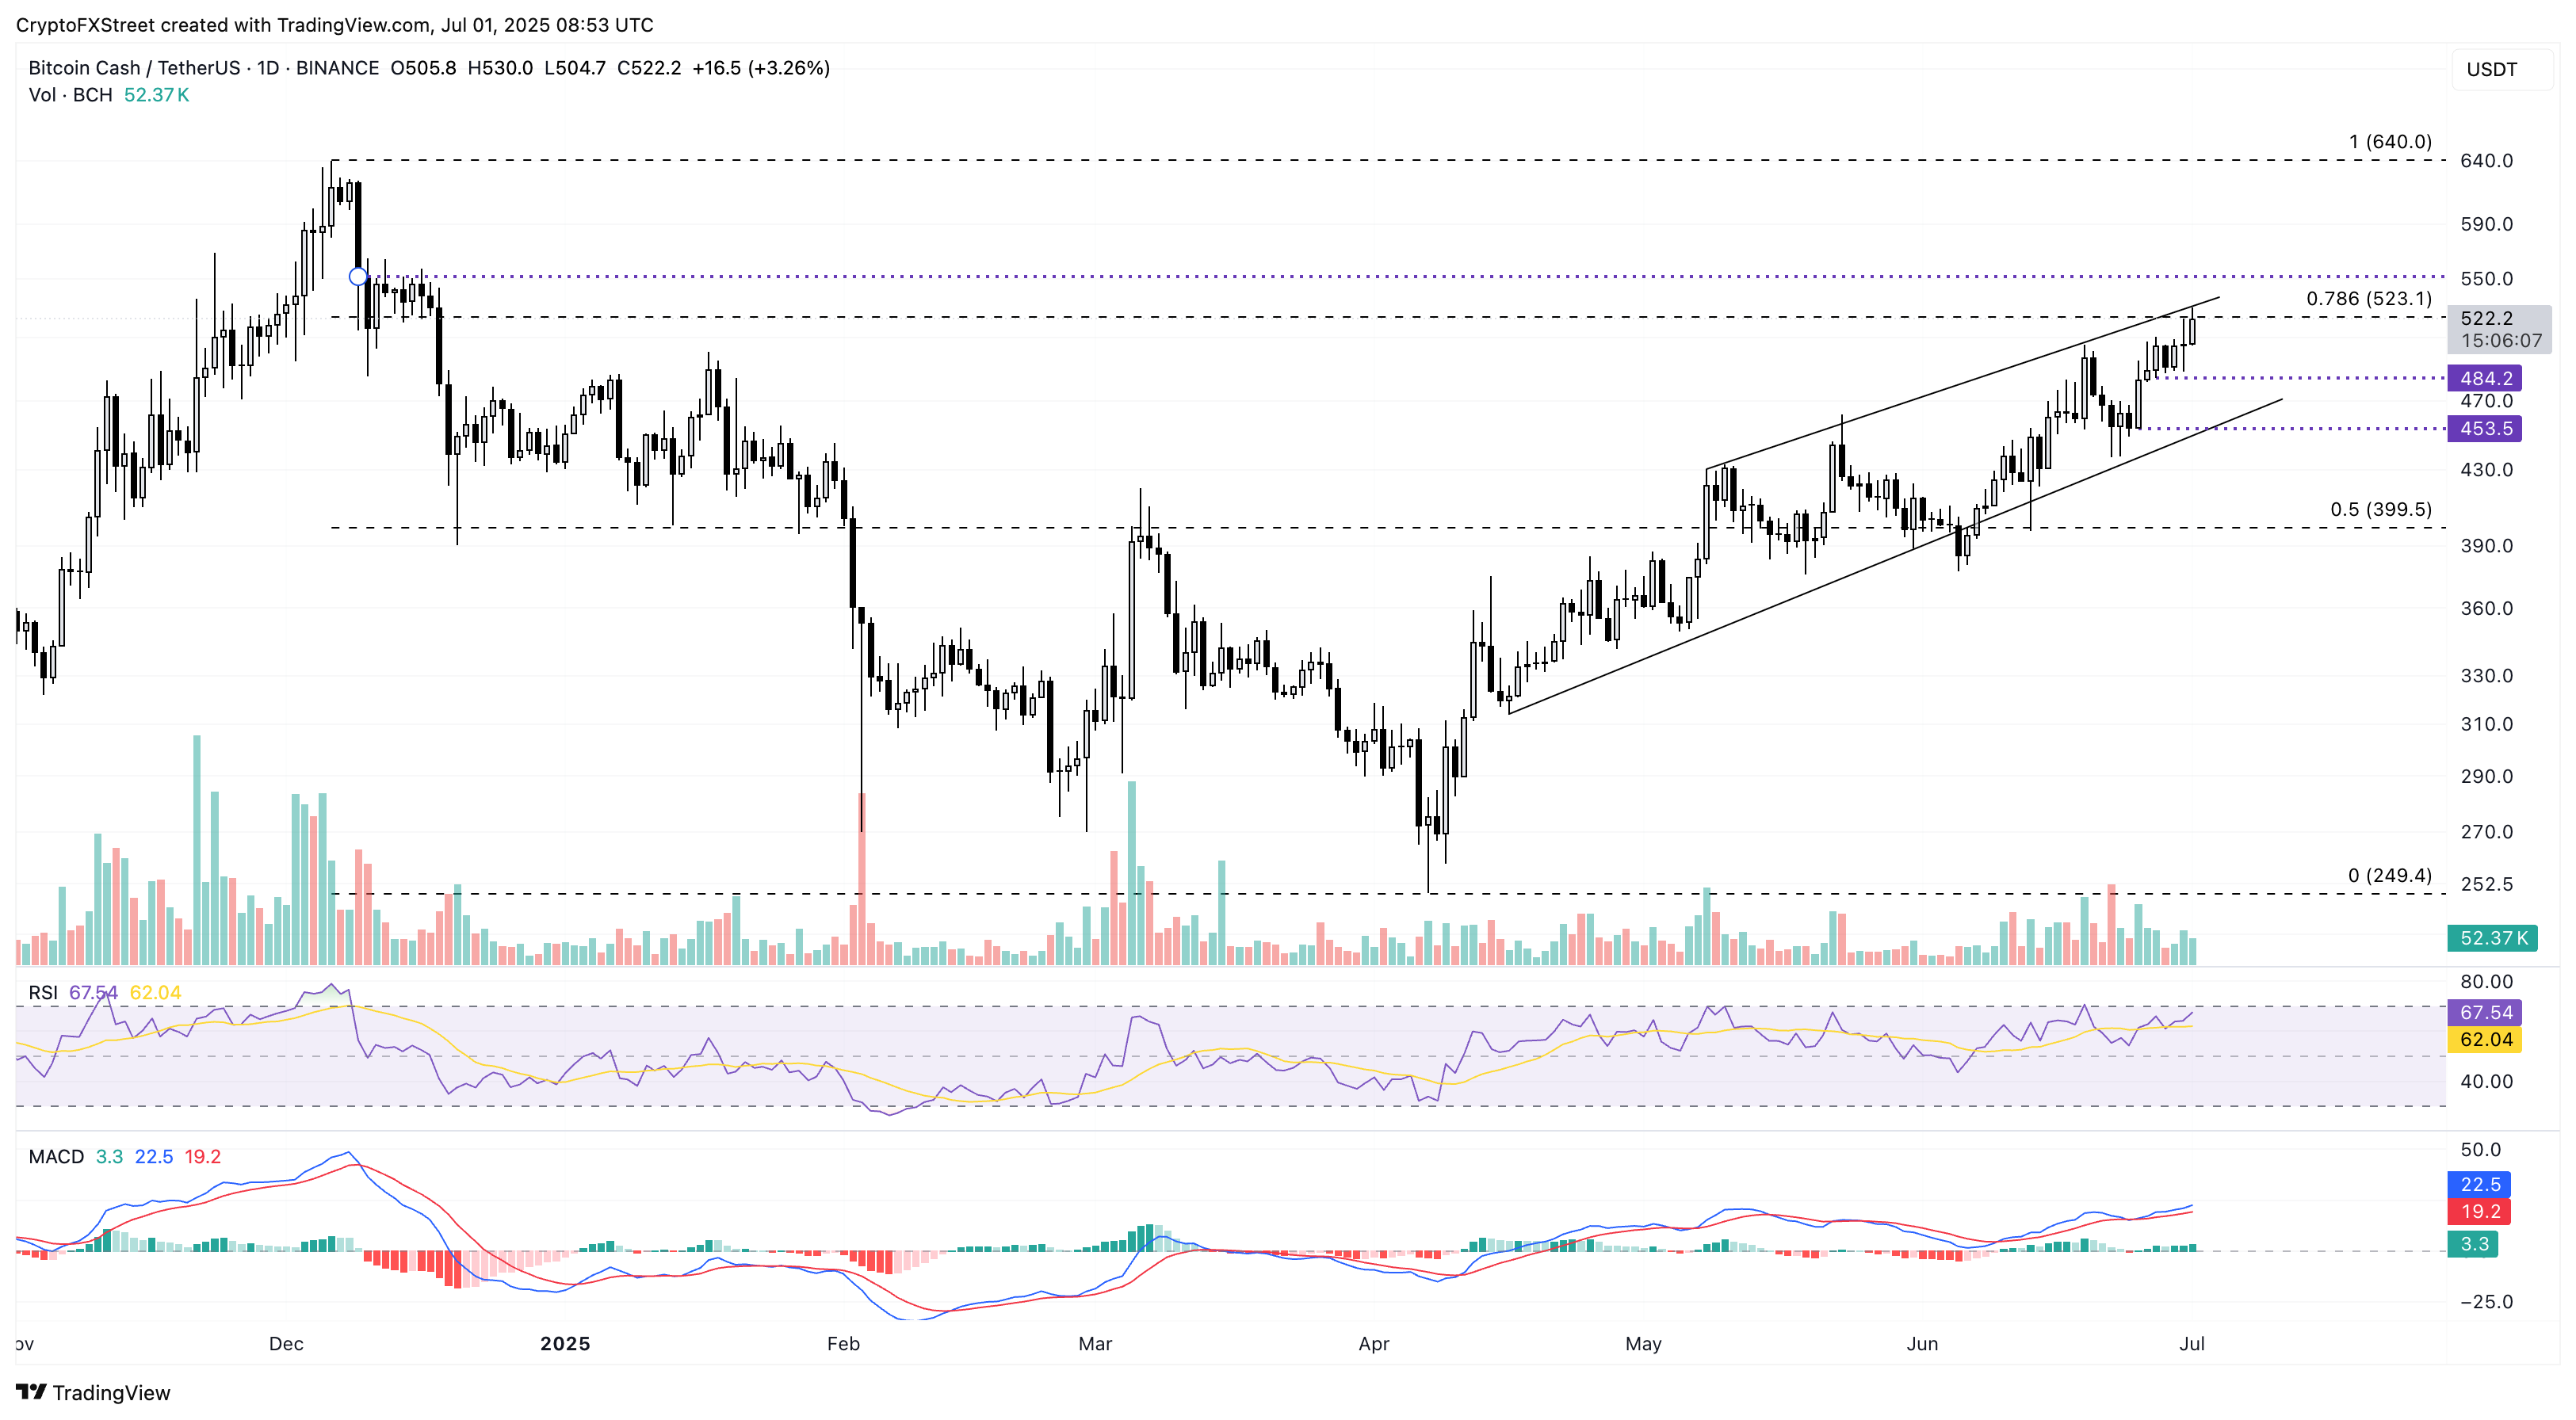
BCH/USDT daily price chart.
However, a reversal from the resistance trendline could cause Bitcoin Cash to decline towards Friday’s low at $484.
Recommended Articles


