
FET Price Prediction: AI-token nears breakout from falling channel as whales confidence recovers
- FET adds onto the 17% gains from Monday, hinting at a potential breakout from a falling channel.
- Whales’ confidence resurfaces as large investors purchase 18 million FET tokens since the May 27 offloading.
- The technical outlook projects a bullish inclination in the momentum indicator, suggesting a potential trend reversal.
Artificial Superintelligence Alliance (FET) ticks higher on Tuesday as bullish momentum sustains following a 17% jump on Monday. The price increase, which outpaces that of a recovering crypto market, could be supported by rising confidence from large-wallet investors, popularly known as whales, who have acquired 18 million FET tokens in the past four weeks.
The technical outlook for FET aligns with the increased market confidence fueled by the ceasefire between Israel and Iran after the 12-day war, suggesting a potential falling channel breakout on the horizon.
FET whales turn confident
Santiment data shows that the total holding of investors with 10 million to 100 million FET tokens has risen to 681 million from the year-to-date low of 663 million on May 27. The acquisition of roughly 18 million FET tokens suggests an increased confidence among large investors.
In contrast, the total holding of investors with more than 100 million FET tokens has fallen to 1.16 billion tokens, from 1.15 billion tokens since May 27. Taken together, the net flow of large investors records 8 million FET tokens, suggesting an overall boost in confidence.
 [11-1750745133264.35.28, 24 Jun, 2025].png)
FET supply distribution. Source: Santiment
FET nears channel breakout, targets the 200-day EMA
FET edges higher by 3% at press time on Tuesday, building on the 17% rise seen on Monday. The AI token recovery targets the sideways-trending 50-day and 100-day Exponential Moving Averages (EMAs) at $0.72.
The dynamic resistances align with the overhead trendline formed by shorter highs on May 23, May 29, and June 11. On the other hand, a parallel support trendline formed by the lows of May 31 and June 22 completes a falling channel.
A potential daily closing above the 100-day EMA, moving close to the overhead trendline, would mark the channel breakout. In this scenario, FET could extend the bullish breakout rally towards the 200-day EMA at $0.85, followed by the $1.04 resistance level, aligning with the highest closing price in February.
The Moving Average Convergence/Divergence (MACD) indicator shows that the MACD line is about to cross above the signal line. Typically, such a crossover indicates a trend reversal, aligning with the channel breakout thesis.
The Relative Strength Index (RSI) points upwards and reaches the halfway level of 50, a quick turnaround from almost the oversold boundary line, signaling a boost in bullish momentum.
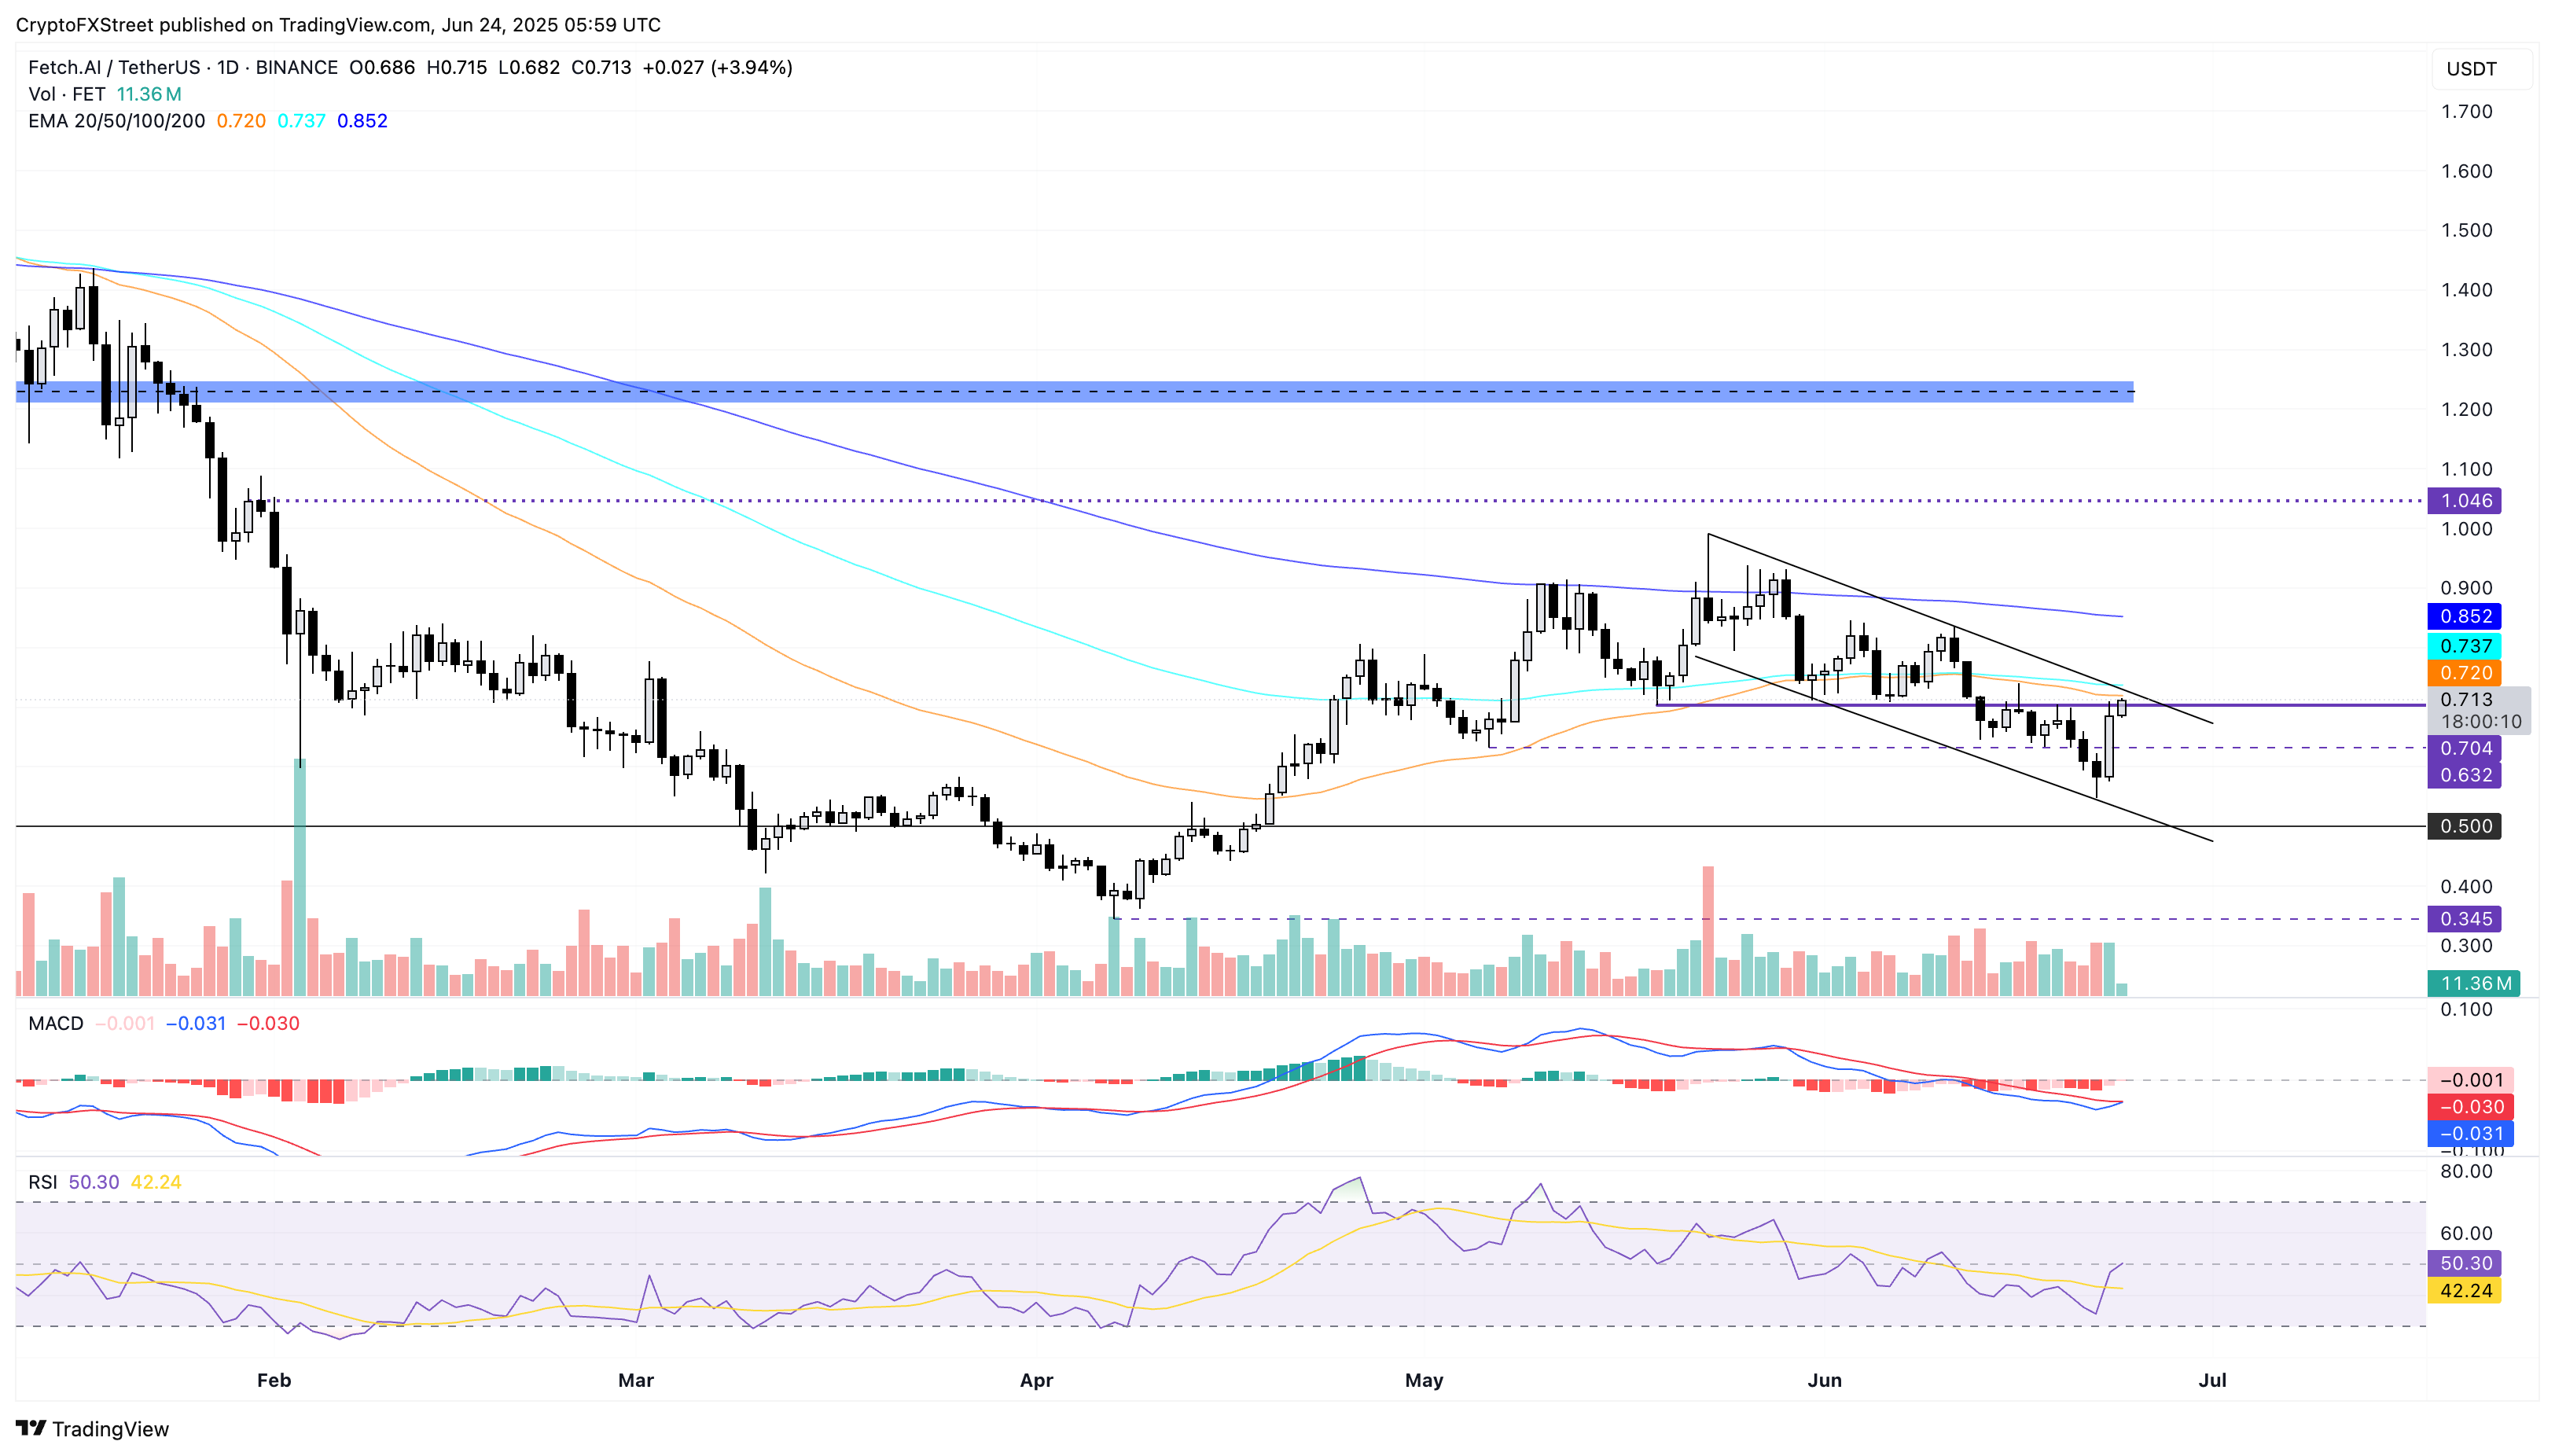
FET/USDT daily price chart.
A failure to surpass the overhead trendline could lead to another pullback within the channel, with the immediate support at the weekly low of $0.548.
Recommended Articles


