Dogecoin Gears Up For 60% Move—Will It Be Up Or Down?
An analyst has explained how Dogecoin could be primed for a 60% price move. Here’s the range that could end up deciding the direction of the break.
Dogecoin Is Nearing The End Of A Triangle Pattern
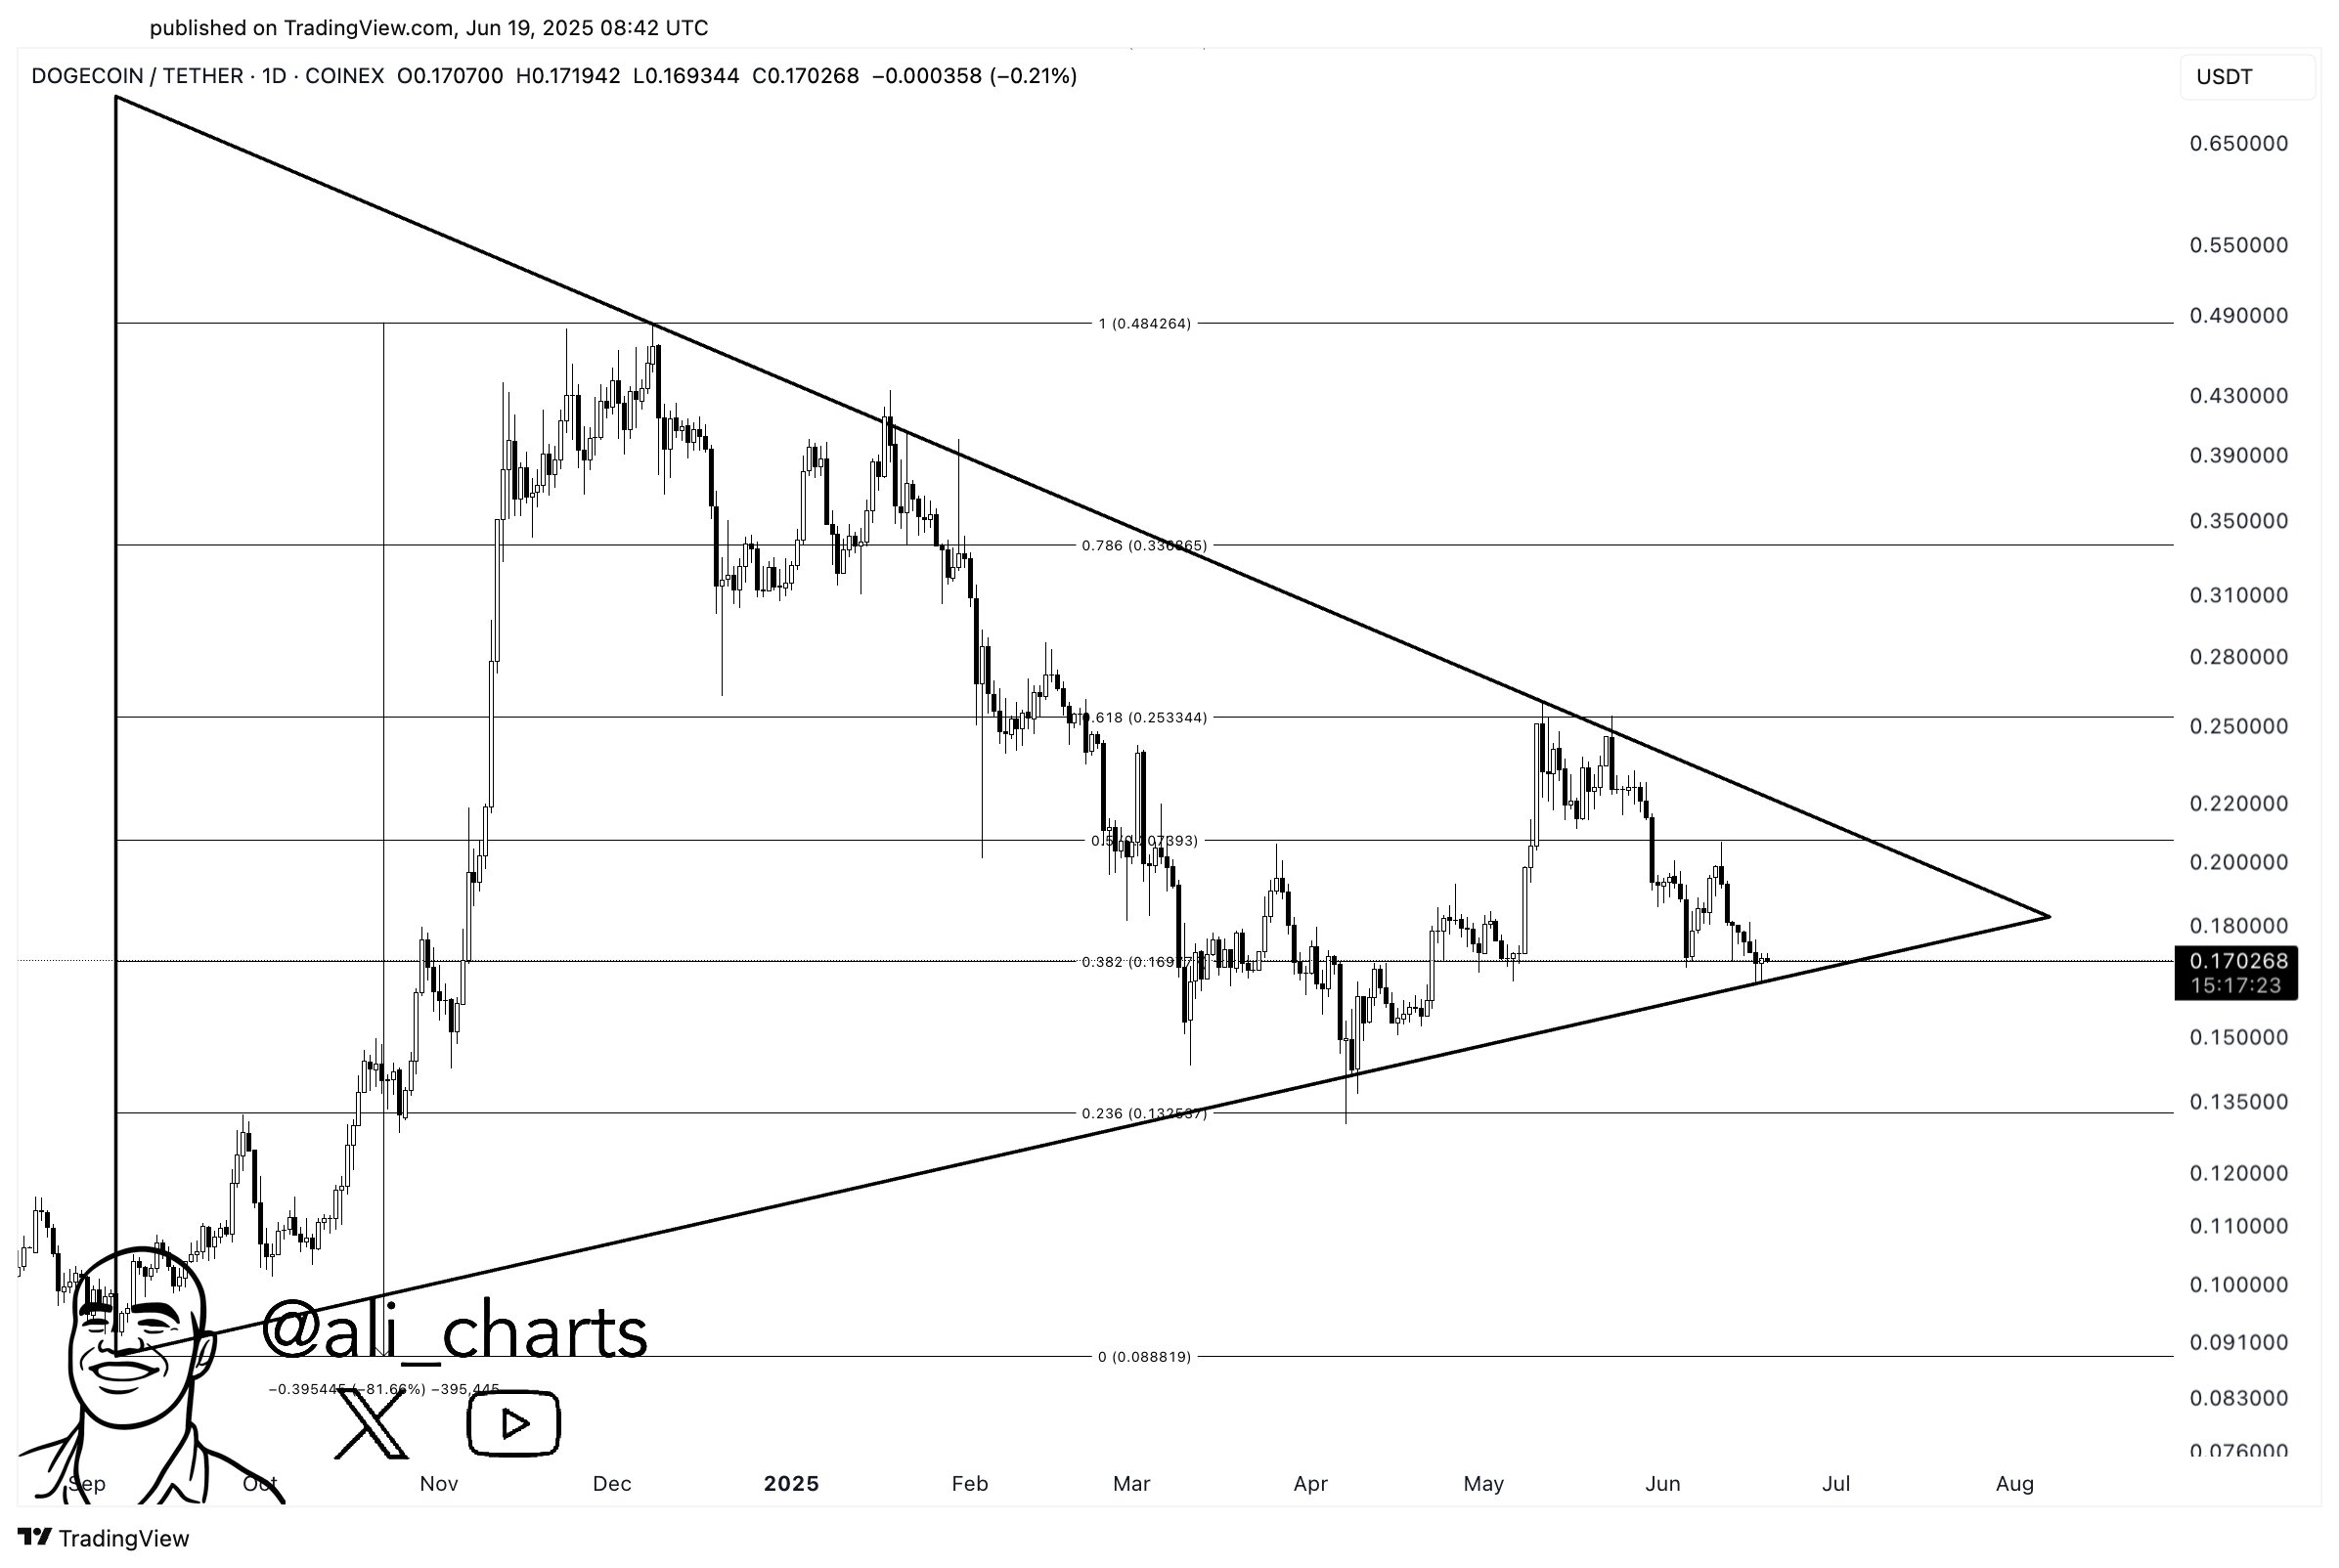
In a new post on X, analyst Ali Martinez has talked about how Dogecoin is currently looking from a technical analysis (TA) perspective. Below is the chart shared by the analyst that shows the trend in the 1-day price of DOGE.

As displayed in the graph, the daily Dogecoin price has been trading inside what appears to be a triangular channel. A triangle is a TA pattern that forms whenever an asset’s price observes consolidation between two converging trendlines.
The upper line of the pattern is likely to provide resistance to the price, while the lower one support. A break out of either of the lines can signal a continuation of trend in that direction.
There are a few different types of triangles, with a few popular ones being the Symmetrical, Ascending, and Descending variations. The orientation of the trendlines decides the type of the triangle.
In a Symmetrical Triangle, the lines converge at a roughly equal and opposite slope. This means that as the price travels inside the pattern, both upward and downward volatility shrinks in an even manner.
For the Ascending and Descending versions, however, there is a bias to the upside or downside. In the former, the upper trendline is parallel to the time-axis and the price progressively makes higher lows. Similarly, the latter involves lower highs with a flat support level.
From the chart, it’s apparent that the Triangle that Dogecoin has been moving inside for the past few months is similar to a Symmetrical Triangle, but it has a slight tilt toward the downside.
It’s also visible that DOGE is nearing in on the end of the triangle. Generally, triangle breakouts become more likely to occur as the asset approaches the apex, as the consolidation range squeezes tight in this region.
Considering that Dogecoin may be in this zone now, it’s possible that its spring may be ready to uncoil. Based on the pattern forming in the daily price, the analyst has noted that DOGE looks primed for a 60% move.
As for which way a break would happen, that naturally comes down to which line the memecoin exits the triangle from. ” All you need to do is wait for a daily close outside of the $0.16 to $0.22 range to determine the direction of the trend,” notes Martinez.
DOGE Price
At the time of writing, Dogecoin is floating around $0.168, down more than 11% over the last seven days.


