
Ethereum Price Forecast: ETH's new valuation framework tags it 'digital oil,' highlights an $8,000 bull case
Ethereum price today: $2,610
- Ethereum is significantly mispriced due to flawed valuation as a tech stock rather than a scarce, yield-bearing store-of-value with strong utility.
- Etherealize says ETH is 'digital oil' and predicts a bull case of $8,000 per ETH in the short term.
- ETH risks validating a rounding top pattern if it fails to recover the $2,750-2,850 range.
Ethereum (ETH) is down 4% on Thursday following a report targeting institutional investors from Etherealize, a firm that advocates for Ethereum on Wall Street. The report presents a valuation framework comparing ETH to digital oil and predicts a bullish case of $8,000 per ETH in the short term.
ETH is 'digital oil' for the digital economy: Etherealize
ETH has one of the "most significantly mispriced opportunities in global markets today," according to a Thursday report from Etherealize titled "The Bull Case for ETH."
Over the past year, ETH has largely underperformed its fellow top cryptocurrencies, Bitcoin (BTC), Solana (SOL) and XRP, still down 45% from its all-time high of $4,878, seen in November 2021. In contrast, Bitcoin has smashed previous highs and set new all-time high records on several occasions since 2024.
ETH's underperformance largely stems from investors applying a tech stock valuation framework to it, which involves treating network fees as revenue based on discounted cash flows (DCF), according to the report.
"Fees alone represent just a fraction of ETH's valuation and significantly undervalues its broader commodity and monetary characteristics," the team led by Vivek Raman and Danny Ryan wrote. "Like Bitcoin, ETH also possesses significant store-of-value properties, commanding a monetary premium that dwarfs revenue-based valuation multiples."
The Etherealize team suggested a valuation model that views ETH as "digital oil," as its utility, coupled with its scarcity — via a unique issuance model and burn rate — puts it in a similar trajectory to oil, but for the digital world.
Similar to oil's dynamic role in powering the traditional economy, thanks to its utility and scarcity, ETH will be the digital oil of the future as the world shifts toward a tokenized economy, the report claimed.

ETH is digital oil. Source: Etherealize
Compared to the $85 trillion worth of oil in global reserves, the report suggests a bullish case for a long-term ETH market cap growth to $89 trillion, translating to $706,000 per ETH. At the same time, it predicted a medium-term and short-term bullish scenario of $80,000 and $8,000 per ETH, respectively.
"ETH uniquely offers investors the highest-upside opportunity to capture blockchain-driven growth in finance, tokenization, and global commerce," the report states. "ETH is more than just a token — it serves as collateral for the on-chain economy, computational fuel, and yield-bearing financial infrastructure. It is actively stockpiled, staked, burned, and utilized."
Investors have begun to show a soft spot for ETH again in the past month as the top altcoin has staged a comeback in Q2 '25. ETH has risen over 90% from lows of $1,400 seen in April. Interest has also been rising on the institutional side, where US spot Ethereum exchange-traded funds (ETFs) recorded $240.29 million in net inflows on Wednesday, marking 18 consecutive days of positive flows, per SoSoValue data.
The development follows progress in establishing proper cryptocurrency regulations, with the Securities and Exchange Commission (SEC) showing support for decentralized finance (DeFi) and increased interest in stablecoins and the broader tokenized asset market.
Ethereum Price Forecast: ETH faces strong selling pressure at $2,850 resistance
Ethereum experienced $128.07 million in futures liquidations, with long and short liquidations totaling $99.26 million and $28.81 million, respectively, over the past 24 hours, according to Coinglass data.
After rising briefly above the $2,850 level, bears quickly leveraged the historic selling pressure near it, pushing ETH below $2,750. If ETH fails to recover this level and declines below the 50-period Exponential Moving Average (EMA) dynamic support, it may form a rounding top pattern as it moves toward the $2,500 support. A further decline from here will validate the pattern and potentially send ETH to find support near the $2,260-$2,110 range.
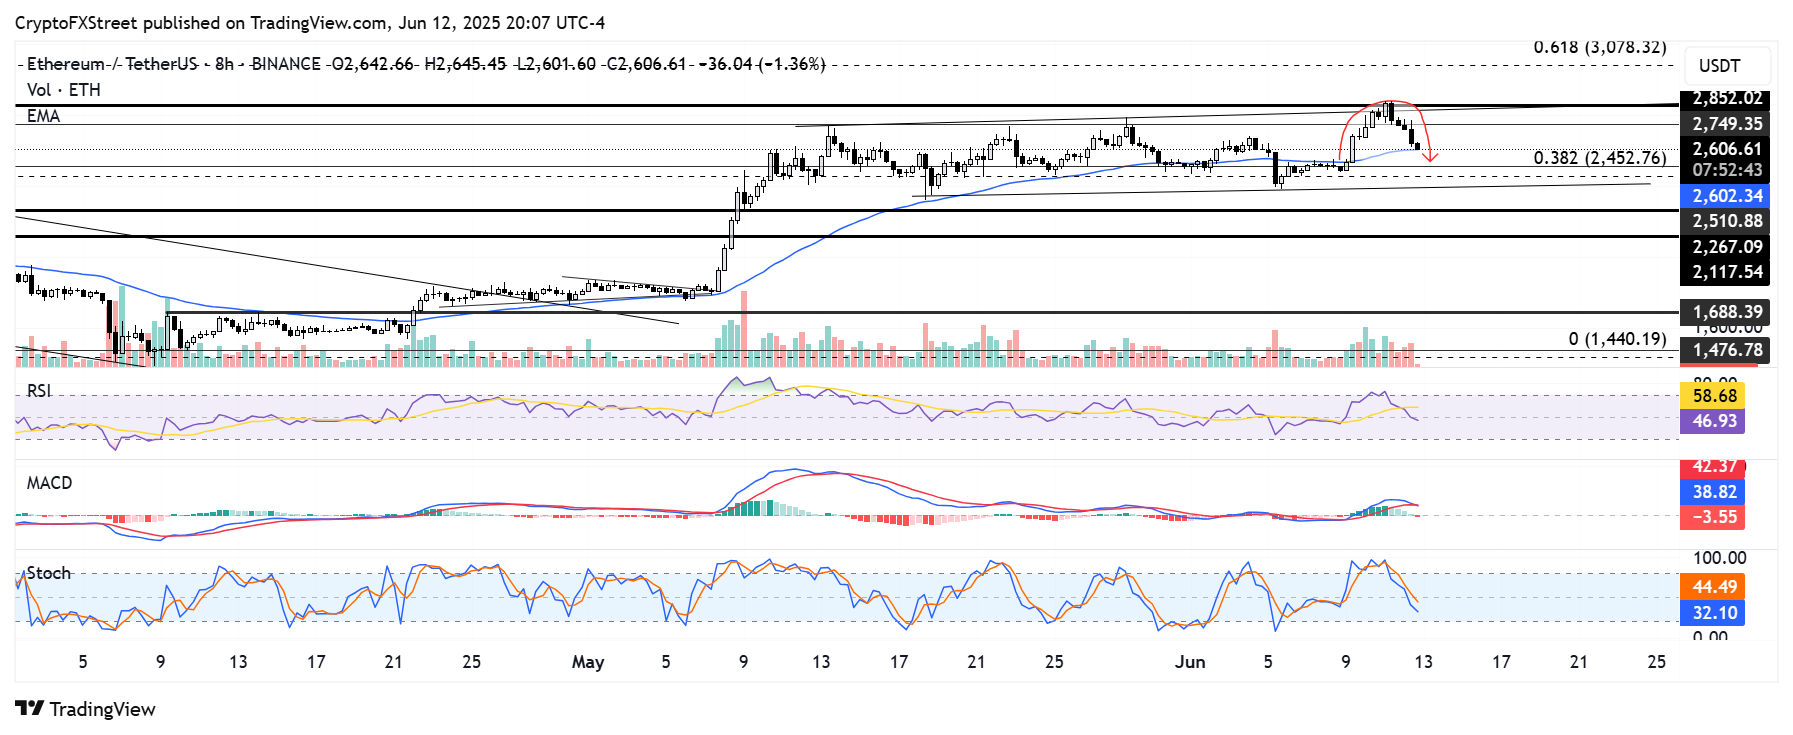
ETH/USDT 8-hour chart
On the upside, ETH needs to firmly recover the $2,750-$2,850 range and hold it as support before it can stage an uptrend toward the $3,400 key level. If ETH pulls such a move, it could face a short-term resistance near the 61.8% Fibonacci retracement at $3,078.
The Relative Strength Index (RSI) and Stochastic Oscillator (Stoch) are trending downward and about to cross below their neutral levels. The Moving Average Convergence Divergence (MACD) is testing its moving average line as its histogram bars test their neutral level. Successful crosses below in these indicators will strengthen the short-term bearish momentum.
A firm decline below $2,110 will invalidate the thesis and potentially send ETH toward $1,800.
Recommended Articles


