


Jupiter Price Forecast: JUP eyes $0.82 as Fluid backs Jupiter's upcoming lending protocol
- Jupiter exchanges announced the upcoming launch of Jupiter Lend, powered by Fluid, on Solana this summer.
- With the announcement of Jupiter Lend, the JUP token surged 16% in the last 24 hours.
- The technical outlook suggests a bullish pattern breakout, fuelling the uptrend.
Jupiter (JUP) is getting the spotlight in the crypto market after months of being under the radar, recording a spike of 16% in the last 24 hours. The revival comes with increasing decentralized finance (DeFi) activities and the announcement of Jupiter Lend. As part of the Solana (SOL) ecosystem, Jupiter exchange plans to expand in the lending business as it partners with Fluid and challenges the current leader in space, Kamino Finance. With new products, JUP price action reveals an inverted head and shoulders pattern breakout, signalling a bullish technical outlook.
Jupiter teams up with Fluid to enter Solana’s money market
Jupiter announces an upcoming DeFi product, Jupiter Lend, powered by Fluid, on Thursday. The exchange claims it to be the most advanced money market on the Solana ecosystem and is expected to launch this summer.
Fluid’s two-layer architecture, the Protocol and Liquidity layers, will power the Jupiter lend. Further up, Jupiter will provide instant liquidity against crypto collateral with yields backed by automated risk safeguards.
The lending protocol will help Jupiter’s vision of becoming a DeFi super app. According to DeFiLlama's data, Jupiter holds $2.677 billion in Total Value Locked (TVL), making it the biggest DEX on Solana.
With the announcement, the Solana users are excited about a new competitor entering the lending space. Marino, a DeFi enthusiast, shared that “days of Kamino Finance dominating this space alone are coming to an end,” in an X post.
Marino adds that more competitors increase the pressure, leading to better products and an ecosystem evolution.
JUP signals trend reversal with a bullish pattern breakout
Jupiter trades higher by 6% at $0.61 on Friday, recording a 20% jump this week, at the time of writing. The DeFi token reclaims the trading price last seen in early March and signals a trend reversal.
Support the trend reversal thesis, the price action since early March shows a strong resistance level at $0.57, keeping the bullish growth in check. However, the surge in underlying bullishness forms an inverted head and shoulders pattern, as highlighted in the daily price chart shared below. This week's recovery rally marks the pattern breakout, a 12% jump on Thursday, surpassing the $0.57 neckline.
The 41% breakout target is calculated by adding the pattern’s depth to the neckline, targeting the $0.82 level.
The Relative Strength Index (RSI) at 68 takes a parabolic surge, closing towards the overbought boundary with the weekly rally. The RSI surge suggests strong upward momentum but warns of overbought risks that could lead to minor pullback.
Furthermore, the Moving Average Convergence/Divergence (MACD) indicator supports the uptrend thesis as it crosses above its signal line, triggering a bullish crossover on Thursday.
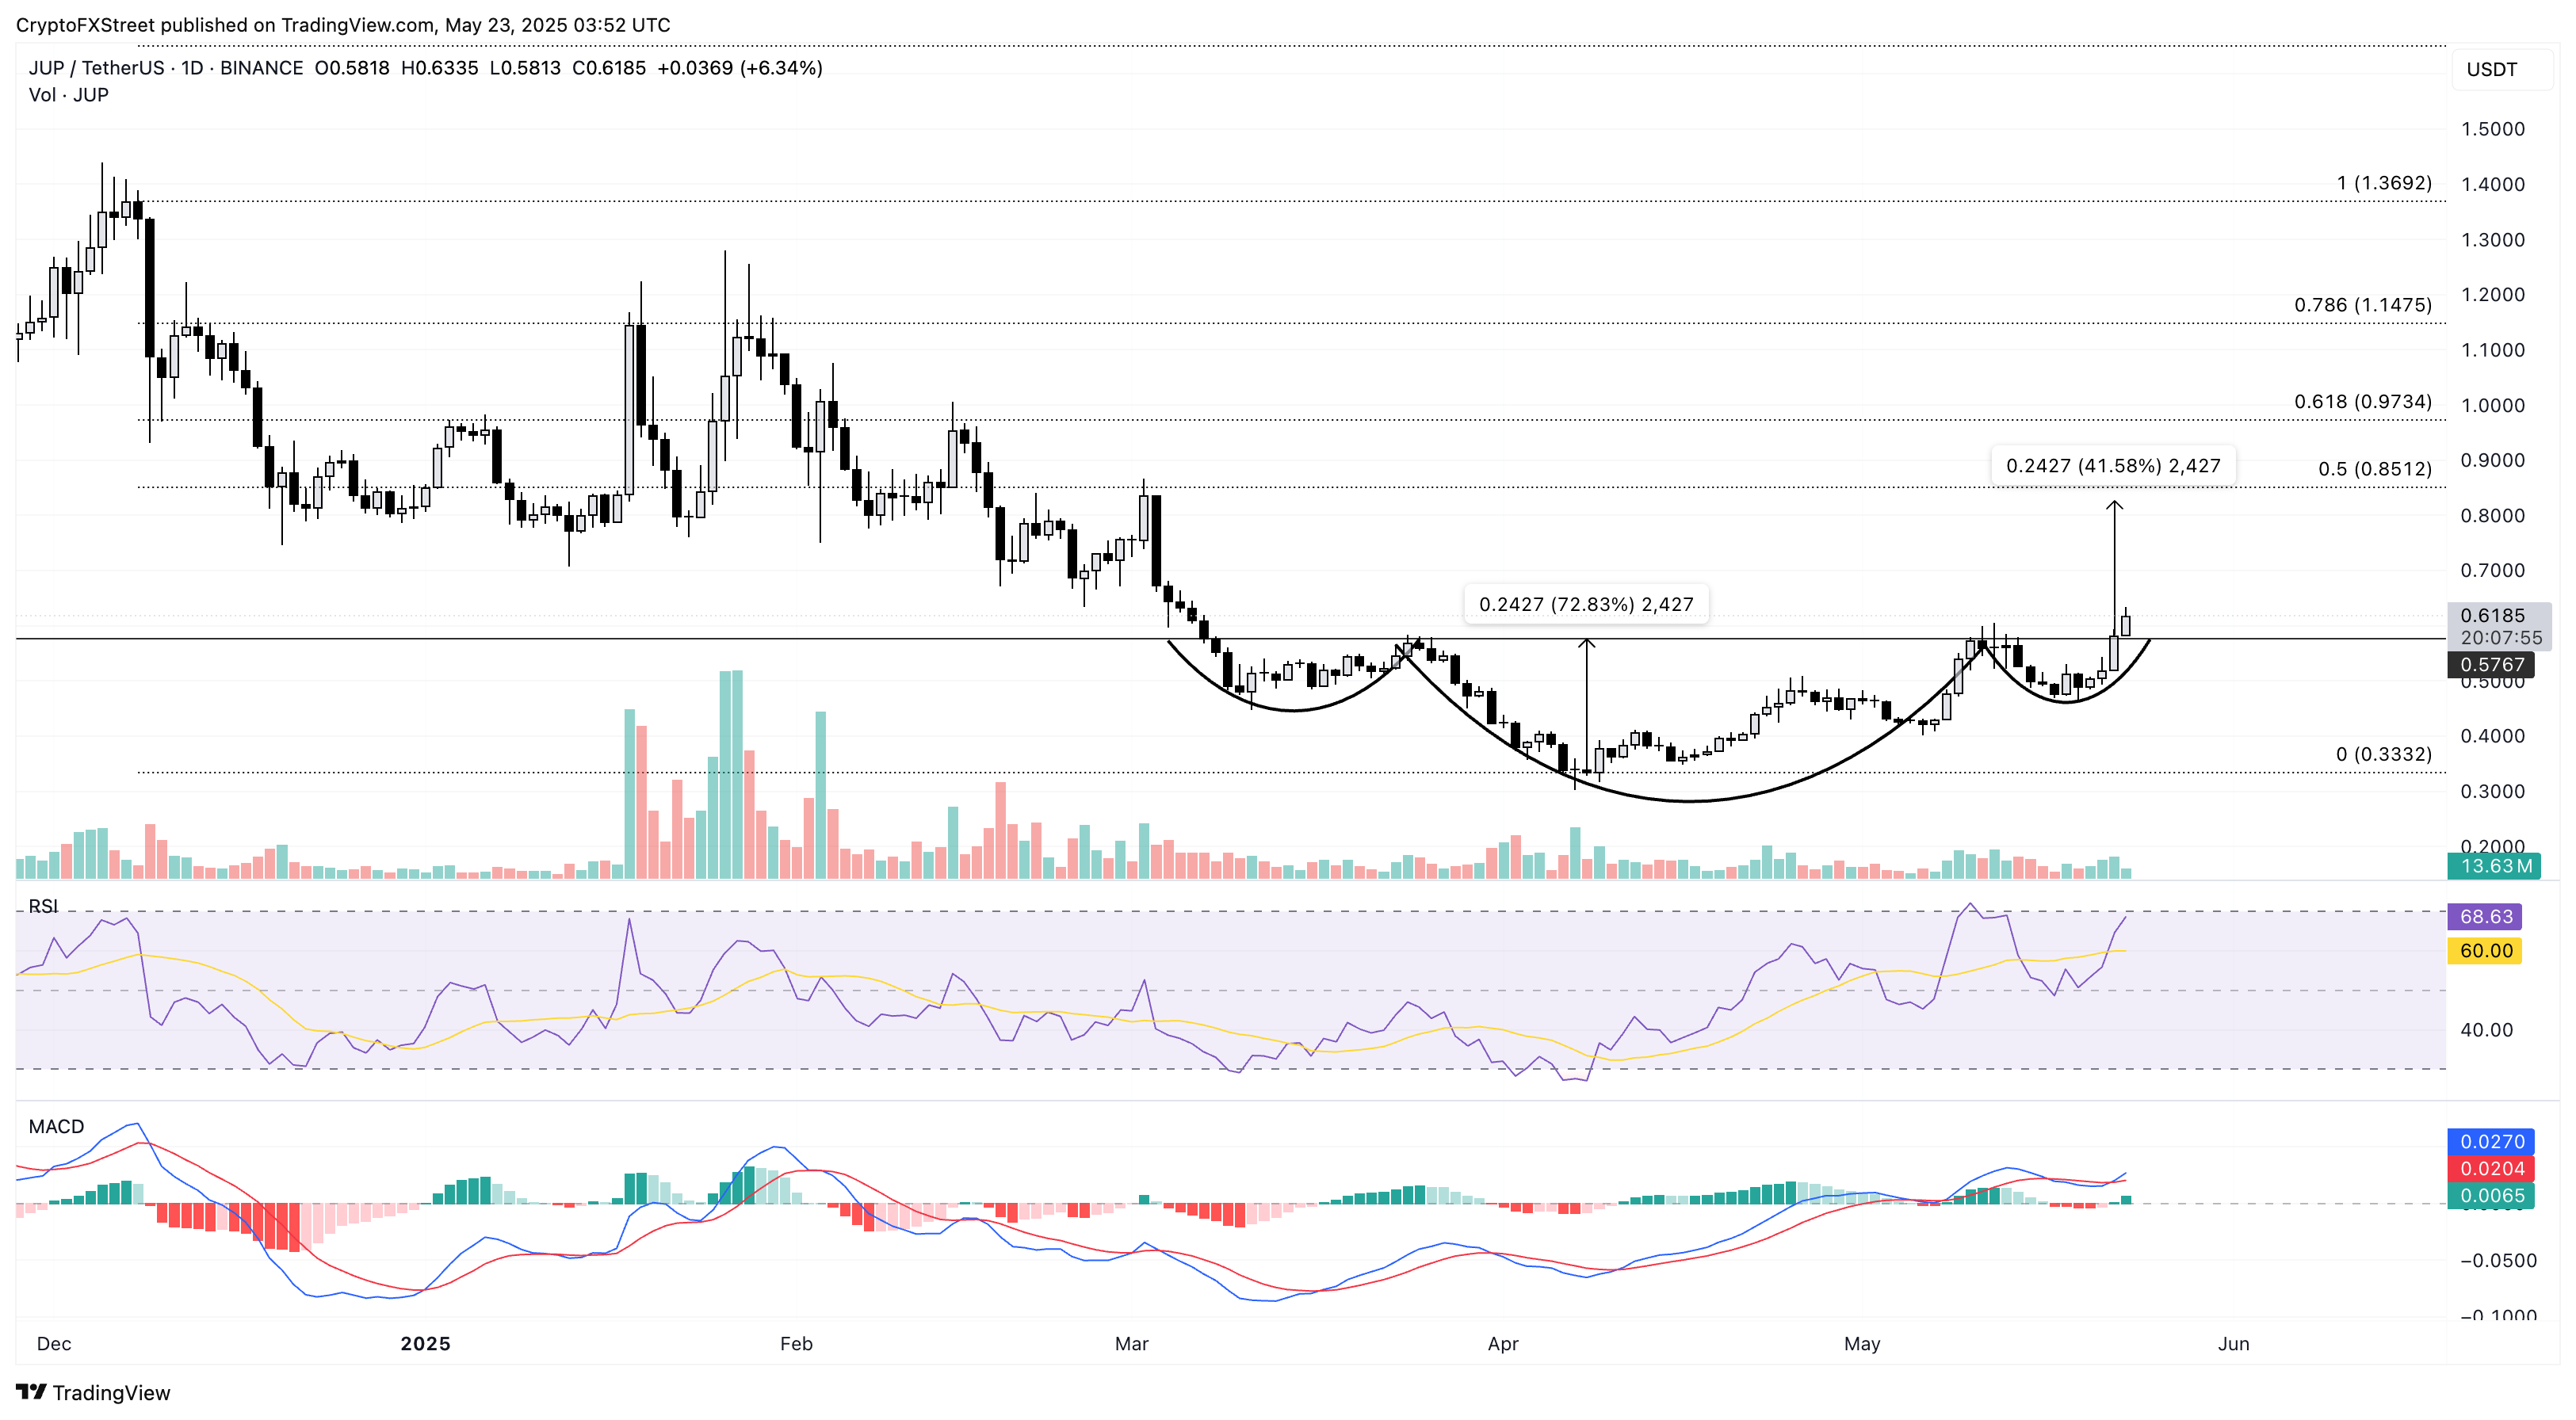
JUP/USDT daily price chart. Source: Tradingview
On the flip side, a potential reversal in JUP could retest the broken neckline at $0.57. However, a decisive daily closing under the neckline will invalidate the bullish pattern breakout and could extend the decline to $0.46, the 7-day low.
Recommended Articles


