


Ethereum Analyst Sets $3,000 Target As Price Action Signals Momentum – Details
Ethereum and the broader crypto market experienced a small but notable pump yesterday, reigniting hopes of a potential trend reversal after weeks of sustained selling pressure. As market uncertainty intensifies, driven largely by global economic tensions and geopolitical strain between the US and China, investors are closely watching for signs of a breakout.
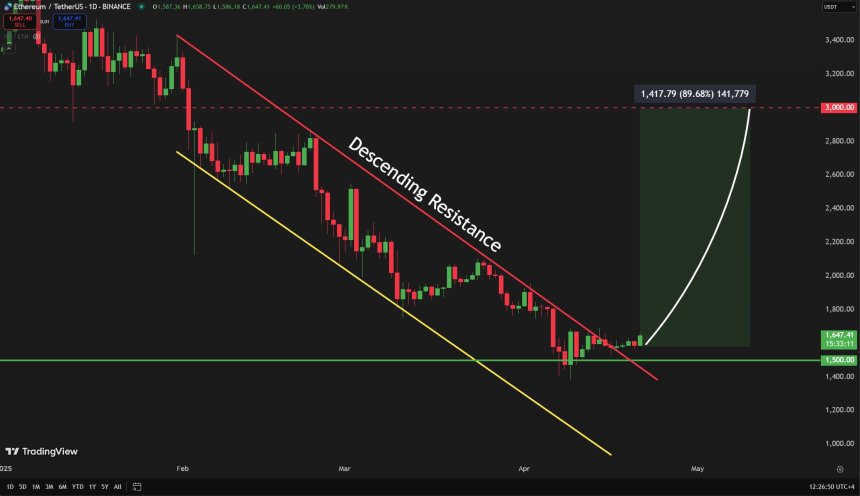
Despite the headwinds, analysts are starting to shift their tone. Some believe that the worst may be behind for Ethereum and that a strong move to the upside could be brewing. One of the most vocal among them is top analyst Carl Runefelt, who shared a bold outlook, suggesting that Ethereum “might go absolutely parabolic starting from here.” His analysis suggests that ETH is poised to break out from a daily descending trendline, which could serve as a key technical signal indicating va shift in momentum in favor of the bulls.
As Ethereum holds above critical support levels and inches closer to a potential trend reversal, traders and investors are now watching closely for follow-through confirmation. If volume and sentiment continue to build, this could be the beginning of a significant rally — one that may reset expectations for the rest of the cycle.
Ethereum Eyes Recovery Amid Rising Global Tensions
Global tensions and macroeconomic uncertainty continue to weigh heavily on investor sentiment, with the ongoing trade war between the US and China sending shockwaves through equities and high-risk assets. In the midst of this fragile backdrop, Ethereum has managed to find a solid support level around $1,500 and is now attempting to reclaim higher ground. After weeks of selling pressure that erased bullish expectations for the year, ETH is showing early signs of recovery.
Ethereum’s current price structure has become a focal point for market participants. The recent bounce from $1,500 marks a potential higher low, a technical setup often associated with trend reversals. If ETH can successfully push above the $1,700 mark and break the descending trendline, it could spark renewed momentum for bulls.
Runefelt shared an optimistic view, stating that Ethereum could go up really fast from here. According to his analysis, the next key price target sits at $3,000, assuming a confirmed breakout above short-term resistance levels.
Despite continued global risks, the Ethereum network remains fundamentally strong, with growing adoption in DeFi and real-world assets. If the breakout materializes and broader market sentiment stabilizes, ETH could lead the next leg of the crypto recovery.
Price Faces Key Resistance As Bulls Struggle for Momentum
Ethereum is currently trading at $1,630 after another failed attempt to break above the $1,700–$1,800 resistance zone. This price range has acted as a major barrier over the past several weeks, limiting bullish momentum and keeping ETH locked in a broader downtrend. Bulls must reclaim the local high at $1,691, set last week, to signal a potential shift in structure and confirm the start of a recovery rally.
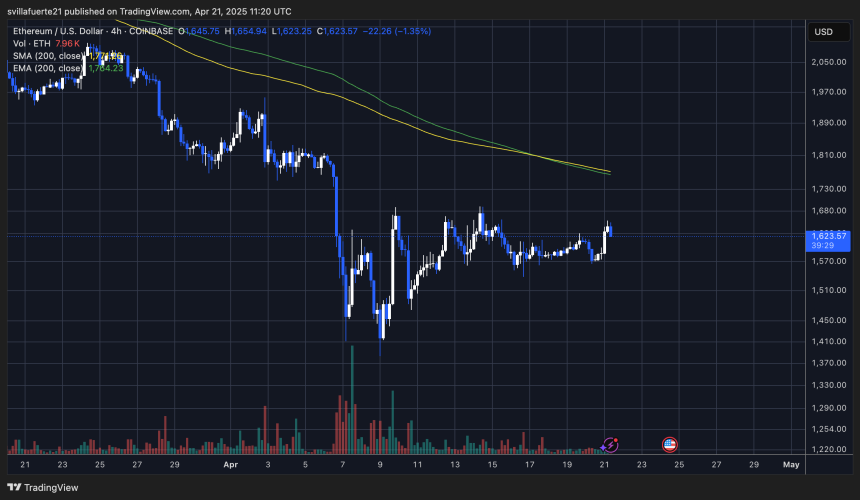
A decisive move above $1,700 could open the door to a test of the $2,000 level, which would mark a significant psychological and technical milestone. However, the lack of follow-through on recent upside attempts reflects ongoing uncertainty across crypto markets, largely driven by macroeconomic tensions and risk-off sentiment.
If Ethereum fails to gain strength above current levels, a retracement toward $1,500 is likely, with the possibility of further downside if selling pressure intensifies. This level has served as a critical support zone in recent weeks. Without a convincing breakout, ETH remains vulnerable to renewed weakness and deeper corrections. All eyes are now on whether bulls can build enough momentum to flip resistance into support and avoid another leg down.
Featured image from Dall-E, chart from TradingView
Recommended Articles


