

XRP Surges to Weekly High as Demand Spikes and Bulls Take Charge
Since plunging to its year-to-date low of $1.61 on April 7, XRP holders have taken full advantage of the dip, ramping up accumulation efforts. This buying pressure has steadily increased the asset’s value over the past week.
At press time, XRP trades at a seven-day high of $2.19 and technical indicators show that it’s positioned to extend the gains.
XRP Golden Cross Drives Bullish Momentum
On the daily chart, a golden cross has formed on XRP’s Moving Average Convergence Divergence (MACD) indicator, which is often viewed as a key signal of a shift toward long-term upside.
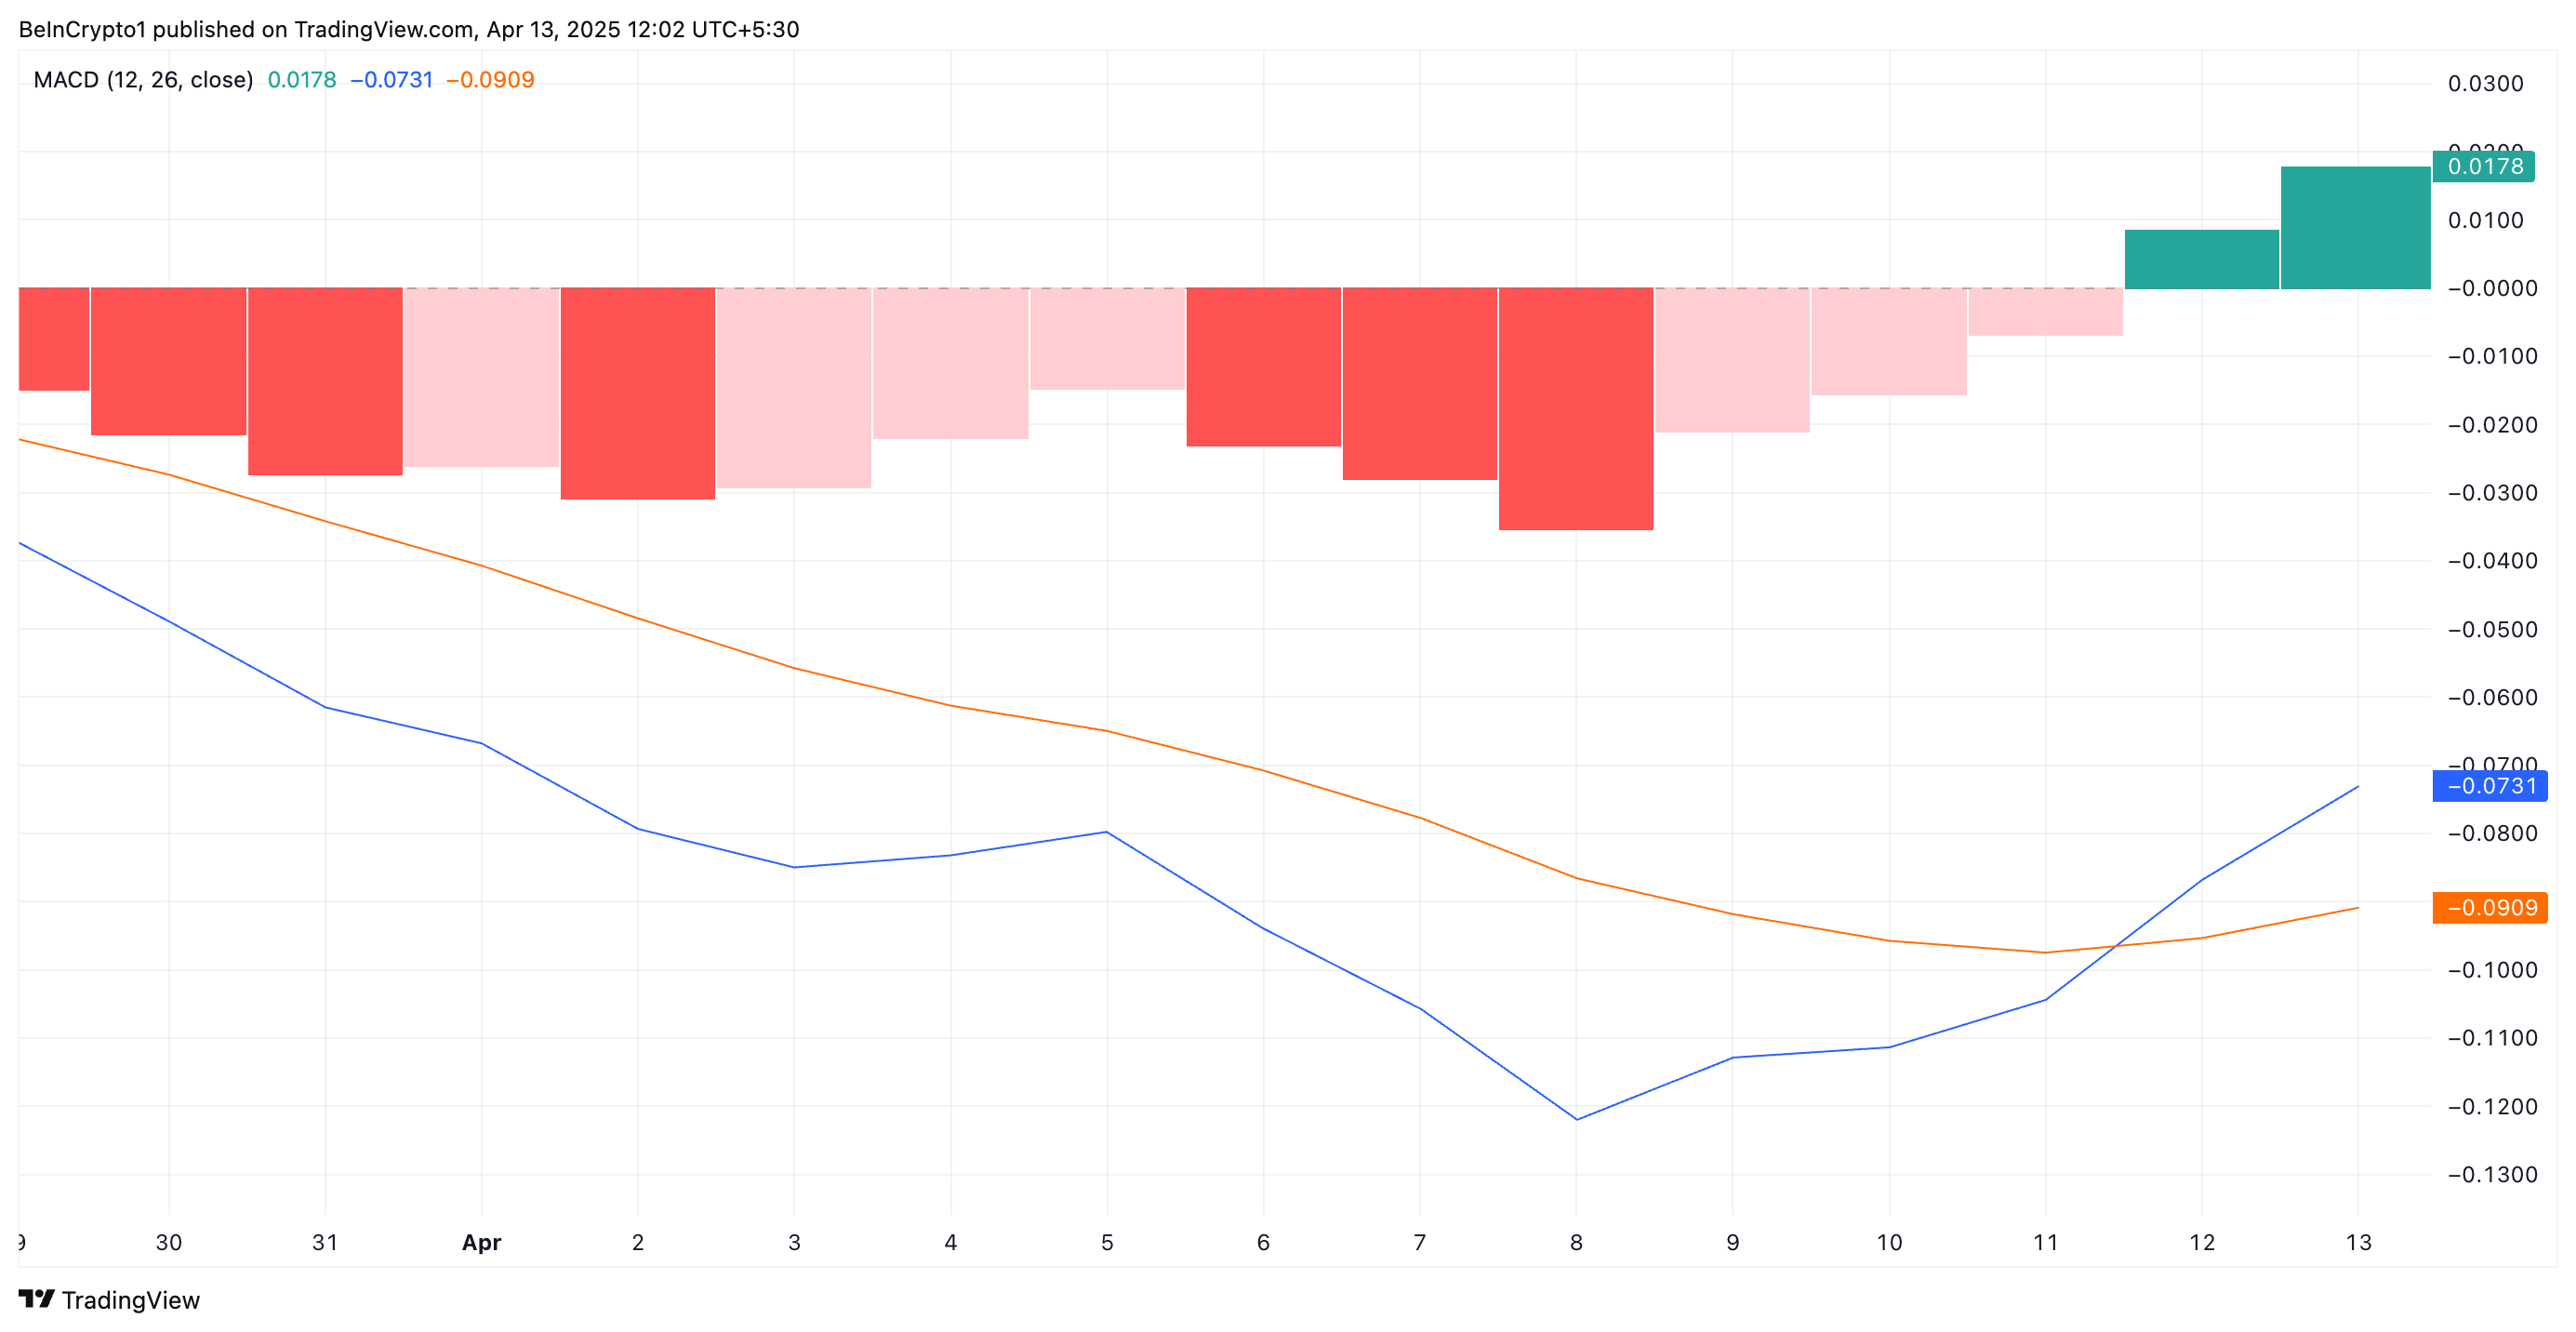 XRP MACD Golden Cross. Source: TradingView
The MACD indicator measures an asset’s price trends and momentum, and identifies reversal points. It forms a golden cross when its MACD line (blue) crosses above its signal line (orange).
When a golden cross emerges like this, it signals a positive shift in investor sentiment. Traders interpret it as a cue that buying pressure outpaces selling activity, which can attract even more inflows and drive the price higher.
For XRP, this golden cross occurred on April 11, reinforcing the growing bullish sentiment surrounding the asset. This pattern confirms that the altcoin’s recent price rebound is not just a short-lived reaction but may mark the beginning of a more sustained uptrend.
Further, the token’s positive Chaikin Money Flow (CMF) supports this bullish outlook. At press time, it rests above the center line and in an uptrend at 0.07.
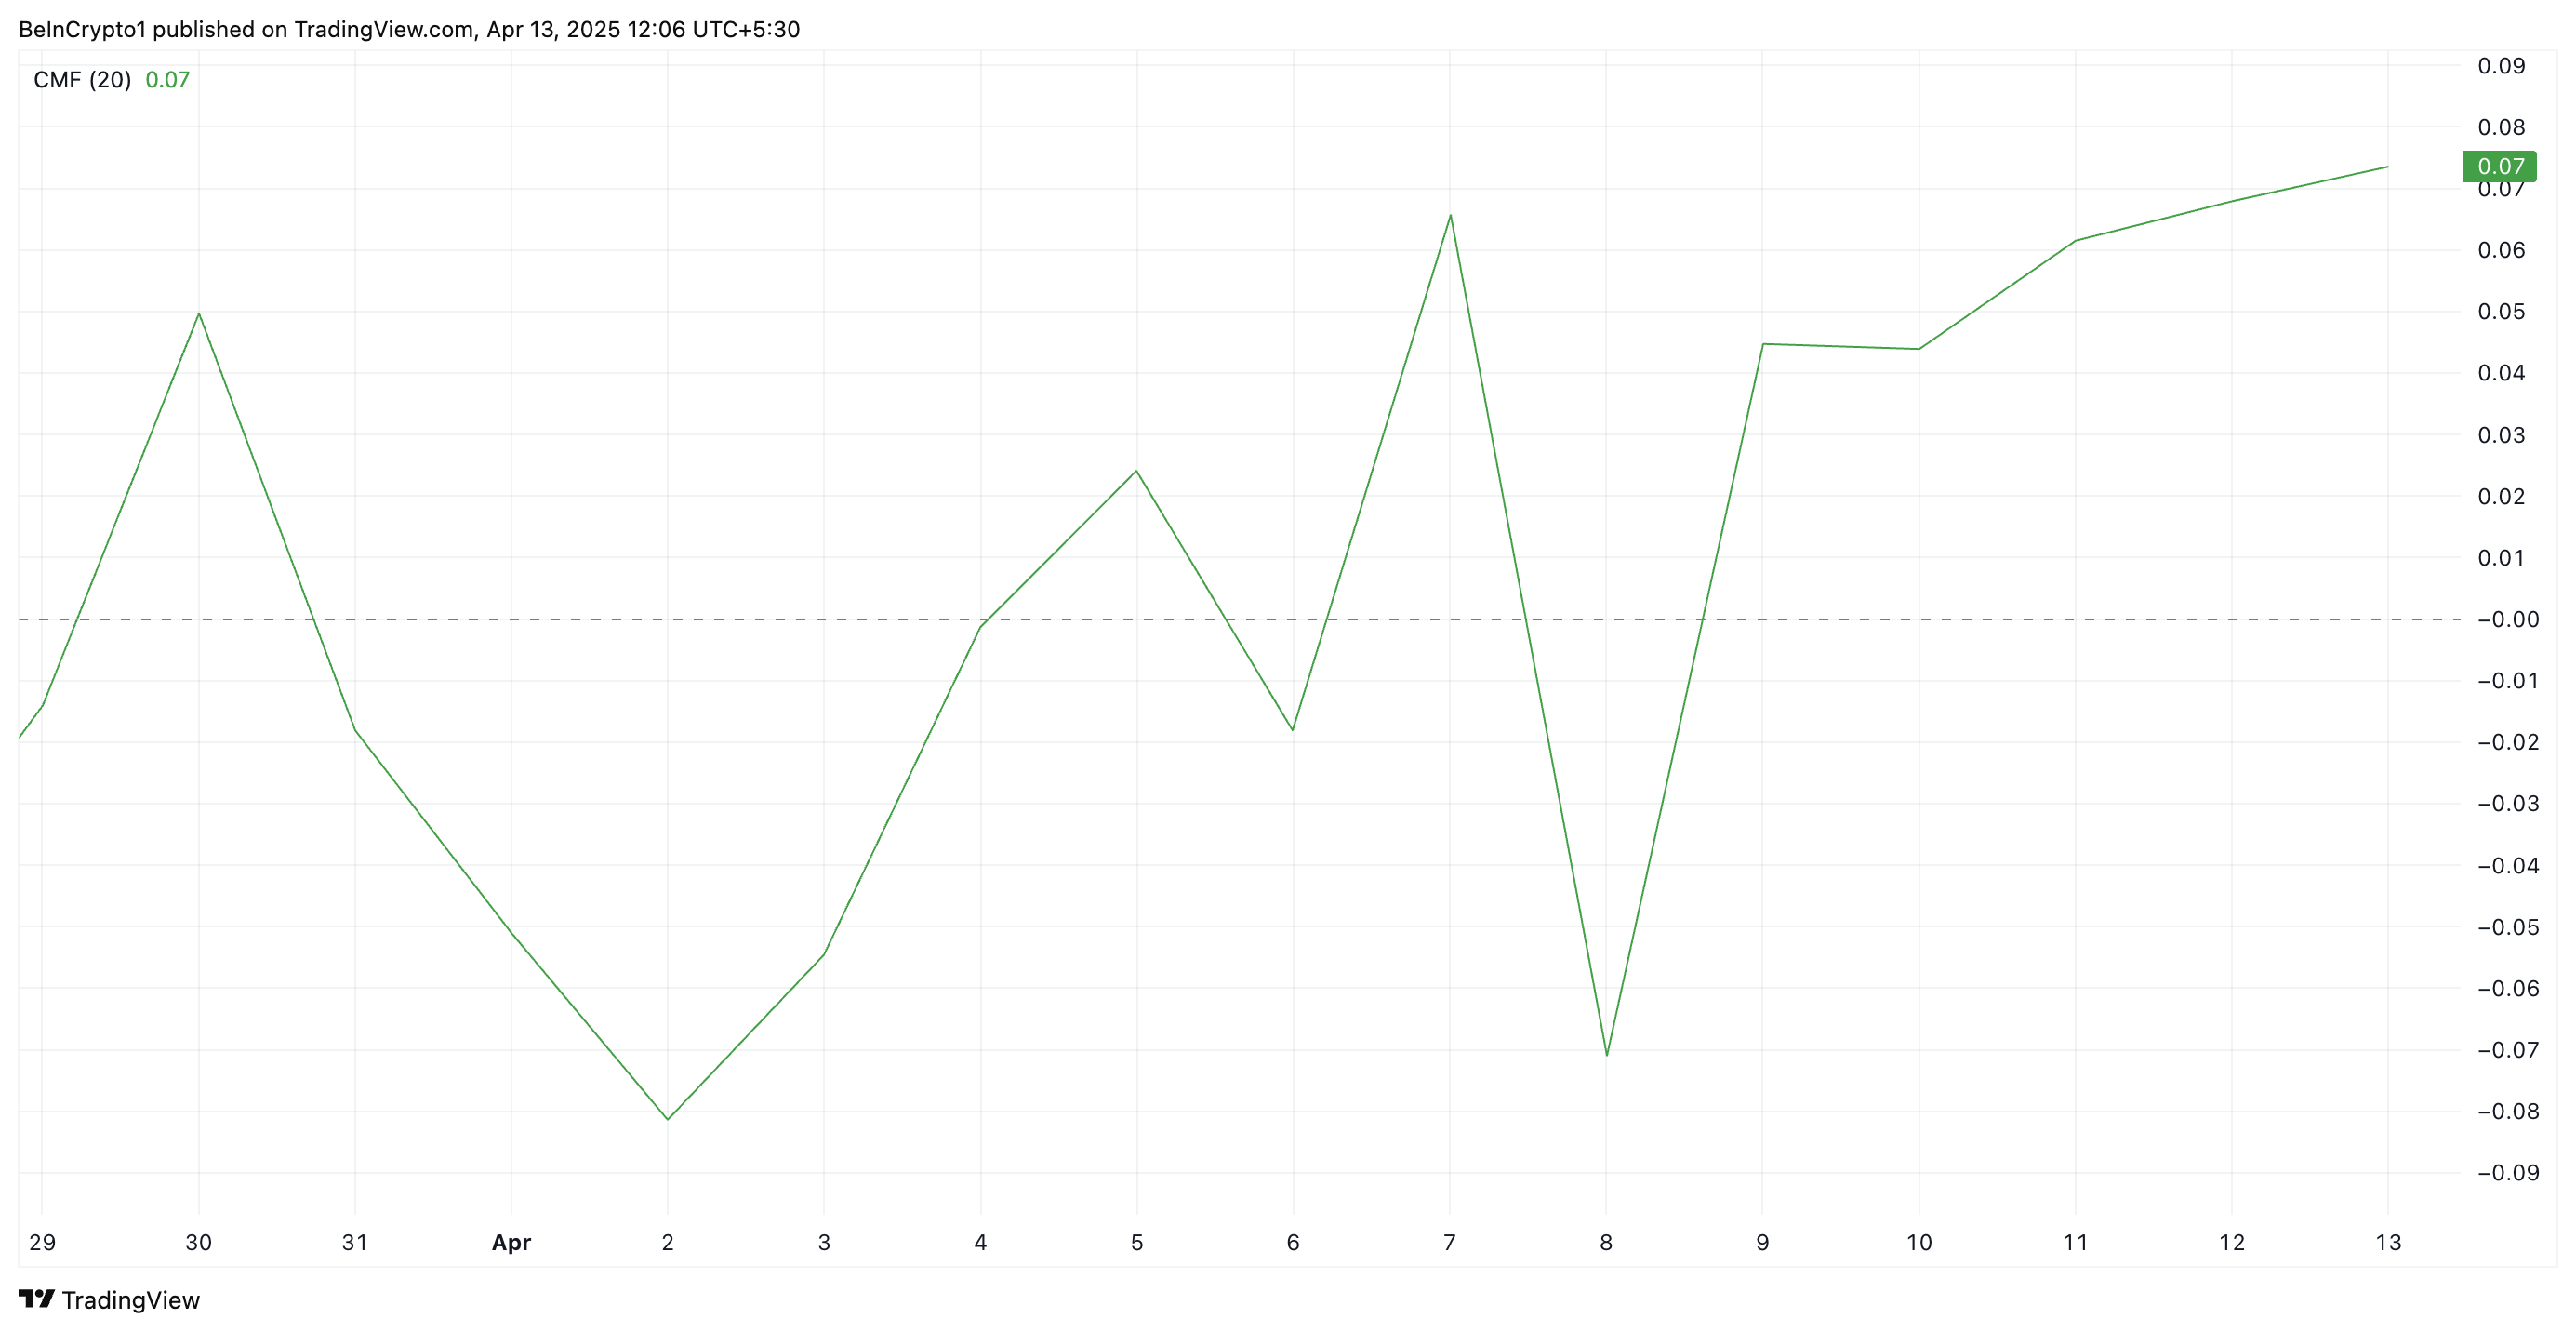 XRP CMF. Source: TradingView
The CMF indicator measures how money flows into and out of an asset. A positive CMF reading, as with XRP, means buying pressure is stronger than selling pressure over a given period. It suggests capital is flowing into the token, signaling accumulation and potential price growth.
XRP Maintains Uptrend—Next Stop: $2.50 or Back to $1.99?
Since its rally began on April 7, XRP has traded above an ascending trend line. This bullish pattern emerges when an asset forms higher lows over time, creating an upward-sloping support line.
It signals sustained buying interest in XRP and suggests that momentum is building in favor of the bulls as the token’s price continues to climb.
If demand soars, XRP could extend its gains and climb to $2.29. A successful flip of this resistance into a support floor could propel XRP to $2.50.
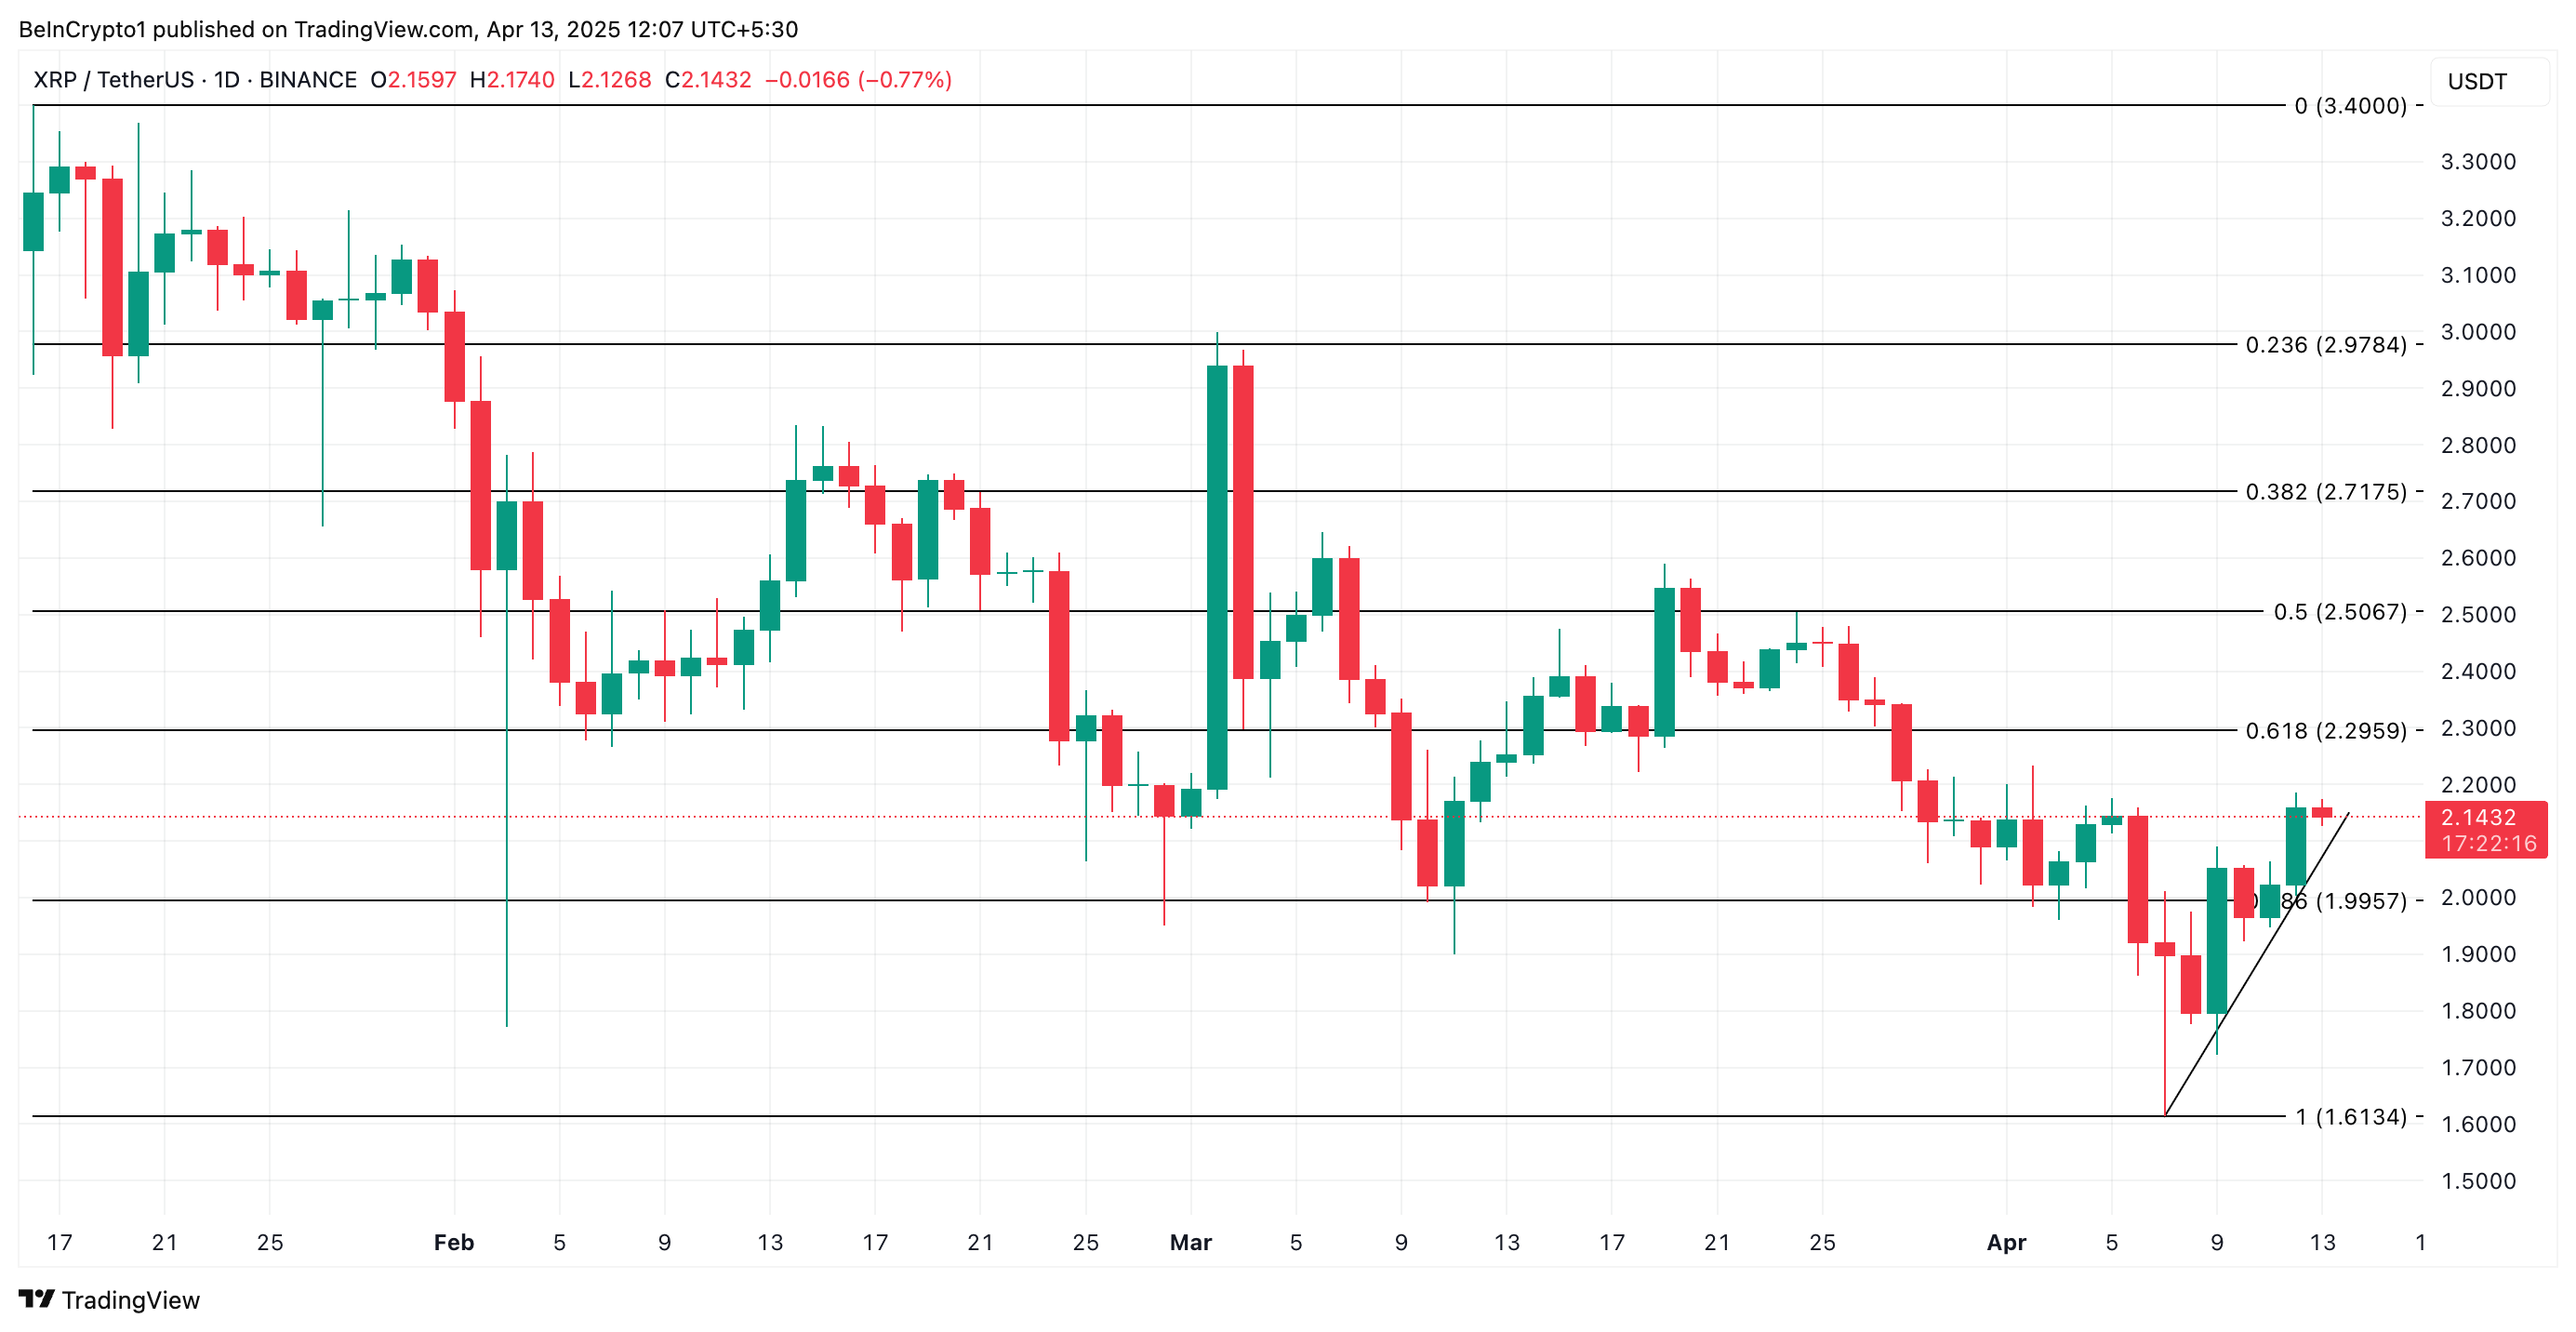 XRP Price Analysis. Source: TradingView
However, if profit-taking resumes and selling pressure rises, XRP could reverse its uptrend and fall to $1.99.
Recommended Articles


