

Ethereum Price Suffers 77% Crash Against Bitcoin, On-Chain Deep Dive Reveals Reasons Why

Source Newsbtc

Despite rolling out a large number of upgrades and innovations, the Ethereum price continues to lag behind Bitcoin (BTC) by a wide margin. Reports reveal that ETH has suffered a staggering 77% price crash against BTC — a decline likely fueled by a mix of technical, macro, and sentiment-driven factors. Notably, On-chain analytics platform, Santiment has now pinpointed and broken down the key reasons behind these price struggles. 

Ethereum Price Nosedives Against Bitcoin

On April 11, Santiment released a detailed report on Ethereum, highlighting its almost four-year underperformance and the reasons behind it. Ethereum, once revered as the cryptocurrency most likely to dethrone Bitcoin, has recently suffered a brutal price decline when measured directly against BTC.

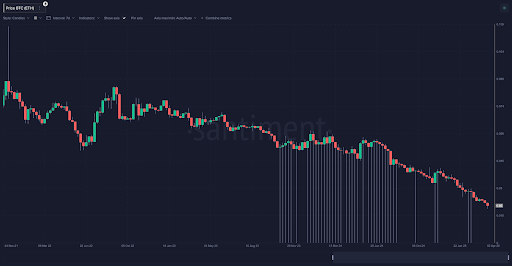
According to Santiment’s on-chain data, Ethereum has crashed by approximately 77% against Bitcoin since December 2021. While the dollar value of ETH hasn’t completely collapsed, especially compared to other altcoins, the long-term BTC/ETH ratio still paints a gruesome picture for Ethereum holders. 
Ethereum

Notably, Ethereum has also failed to recover anywhere near its November 2021 all-time high of $4,760. In contrast, Bitcoin has surged ahead, reclaiming much of its market dominance and outpacing ETH across almost every timeframe. 

This disparity has led many traders and former maximalists to compare ETH to a “shitcoin.” Even worse, various mid to low-cap altcoins have already outperformed Ethereum over the short, mid, and long-term timeframes, causing further embarrassment for the world’s second-largest cryptocurrency by market capitalization. Based on Santiment’s report, the ETH/BTC price ratio chart alone is enough to trigger doubt and uncertainty among long-term holders.

Behind The Scenes Of Ethereum Price Struggles

Beyond price action and market volatility, Santiment reveals that there are fundamental reasons for Ethereum’s sluggish performance over the years. Some of the major criticisms that analysts and traders have pinpointed include technical, sentimental, and regulatory issues.

Ironically, Ethereum’s Layer 2 solutions are one of the key drivers of its underperformance. L2 solutions like Arbitrum, Optimism, and zkSync are reportedly cannibalizing activity on the mainnet, taking investments from ETH while spreading investor attention thin. 

Secondly, Ethereum seems to struggle with complex roadmaps and communication, which has led to investor confusion. Major updates like The Merge and Shanghai have been difficult for investors to comprehend, making ETH feel less accessible than BTC. 

Thirdly, users remain frustrated by Ethereum’s relatively high gas fees and the slow rollout of key upgrades. This has pushed them toward more affordable and faster alternatives, significantly reducing adoption.

Another primary reason for Ethereum’s crash against Bitcoin is ongoing regulatory concerns. Unlike Bitcoin, which has a more established legal precedent, Ethereum faces constant uncertainty about whether it could be labeled a security. 

Other points include ETH’s lack of investment appeal. While Bitcoin maintains the title as a stable digital gold, Ethereum appears to be caught in between, having no clear or attractive investment narrative. Moreover, newer blockchains like Solana and Cardano are also attracting a significant number of users with cheaper and faster solutions, ultimately pulling investments away from ETH.

The final reason Santiment has identified for Ethereum’s long-term price descent is rising selling pressure. Post-upgrade withdrawals of stakes ETHs have created steady sell-side pressure, limiting growth and momentum compared to Bitcoin.

Ethereum
Disclaimer: For information purposes only. Past performance is not indicative of future results.
placeholder
The Fed will sit still on October 28 — but 100 of 100 economists now expect a December hikeA Reuters poll run October 16-20 found 94 of 100 economists expecting the Fed to hold at 3.75-4.00% on October 28 — and all 100 expecting a hike in December, against less than half a month earlier. The market is close to the same price, with CME FedWatch at roughly 17% for October and 82.8% for December. With the Fed in blackout since October 17, here are the five dates that decide the rest of the year, what each one is priced for, and the two directions each can take.
Author  Irene Q.
Oct 22, Thu
A Reuters poll run October 16-20 found 94 of 100 economists expecting the Fed to hold at 3.75-4.00% on October 28 — and all 100 expecting a hike in December, against less than half a month earlier. The market is close to the same price, with CME FedWatch at roughly 17% for October and 82.8% for December. With the Fed in blackout since October 17, here are the five dates that decide the rest of the year, what each one is priced for, and the two directions each can take.
placeholder
Gold Price Analysis Today | Forex Gold Analysis | XAU/USD Analysis - October 23, 2026Get the latest gold price analysis, forex gold insights, and XAU/USD analysis for October 23, 2026. Read on for the details.
Author  Mitrade
Oct 23, Fri
Get the latest gold price analysis, forex gold insights, and XAU/USD analysis for October 23, 2026. Read on for the details.
placeholder
Nasdaq closes at 26,008.86 — 8.9 points above 26,000, and the credit market never blinkedThe Nasdaq Composite fell 2.60% to 26,008.86 on October 22, its worst session since June, as Meta sank 6.98% on 2026 capex guidance of $135–145 billion. But the equal-weight S&P 500 rose 0.73%, high-yield credit was flat and 10-year yields fell 20 basis points. This was an AI de-rating, not a risk-off event — here is the transmission chain, the 29,000 / 28,200 levels and what would prove it wrong.
Author  Irene Q.
Oct 23, Fri
The Nasdaq Composite fell 2.60% to 26,008.86 on October 22, its worst session since June, as Meta sank 6.98% on 2026 capex guidance of $135–145 billion. But the equal-weight S&P 500 rose 0.73%, high-yield credit was flat and 10-year yields fell 20 basis points. This was an AI de-rating, not a risk-off event — here is the transmission chain, the 29,000 / 28,200 levels and what would prove it wrong.
placeholder
Brent tops $113 on Saudi supply risk — but the diesel line in the EIA report is the tellBrent's December contract settled at $113.17 on October 22, up 4.00% and the highest close since May 4, after Saudi Arabia restricted refined-product shipments. The same session's EIA report showed crude stocks down 3.06 million barrels and gasoline down 2.95 million — but distillates built 1.68 million. That single line decides whether $113 holds: here are the data, the 108.8 / 114.0 / 119.3 levels and the two scenarios.
Author  Irene Q.
Oct 23, Fri
Brent's December contract settled at $113.17 on October 22, up 4.00% and the highest close since May 4, after Saudi Arabia restricted refined-product shipments. The same session's EIA report showed crude stocks down 3.06 million barrels and gasoline down 2.95 million — but distillates built 1.68 million. That single line decides whether $113 holds: here are the data, the 108.8 / 114.0 / 119.3 levels and the two scenarios.
placeholder
Gold Price Analysis Today | Forex Gold Analysis | XAU/USD Analysis - October 26, 2026Get the latest gold price analysis, forex gold insights, and XAU/USD analysis for October 26, 2026. Read on for the details.
Author  Mitrade
1 hour ago
Get the latest gold price analysis, forex gold insights, and XAU/USD analysis for October 26, 2026. Read on for the details.
goTop
quote