

Bitcoin Price Forecast: BTC recovery capped amid US-China trade tensions, prolonged government shutdown

- International Oil Prices Retreat Rapidly; G-7 to Discuss Emergency Oil Reserve Release
- Senate to vote on Trump’s pro-Bitcoin Fed pick as BTC hits four-week high
- Gold slumps below $5,100 as US Dollar gains
- Crypto’s Great Recovery: Is the Post-Conflict Surge a Sustainable Rally or a Sophisticated Bull Trap?
- WTI recovers to near $86.50 as Strait of Hormuz remains closed
- Gold slumps to near $5,050 on oil-driven inflation fears, stronger US Dollar

Bitcoin price edges below $112,500 on Wednesday, struggling to extend its rebound amid renewed macroeconomic headwinds.
Fresh US-China trade tensions and the ongoing US government shutdown dampen investor sentiment, limiting BTC's recovery.
Report suggests the coming weeks could present a favorable window for BTC accumulation, as funding dynamics and perpetual markets normalize.
Bitcoin (BTC) price edges below $112,500 at the time of writing on Wednesday as the recovery momentum appears to be losing steam due to resurfacing broader macroeconomic pressures. Renewed US-China trade tensions and the prolonged US government shutdown have dampened market sentiment, keeping investors cautious. Despite these challenges, the normalization of funding dynamics and perpetual markets could set the stage for a constructive rebound in the coming weeks.
Fresh trade tensions between the US and China weigh on investors' mood
The ongoing trade tension between the world's two largest economies, the US and China, continues to escalate as the week proceeds. US President Donald Trump threatened on Tuesday to terminate trade with China in cooking oil and other products in response to the latter's decision not to purchase US soybeans. China also announced new special port fees for US ships arriving in Chinese ports and enhanced restrictions on the export of rare earths.
These tensions sank markets, with riskier assets such as Bitcoin declining nearly 2% on Tuesday and continuing to trade red below $112,500 when writing on Wednesday.
In addition to the prevailing bearish sentiment, escalating geopolitical tensions between Russia and Ukraine continue to fuel risk-off sentiment among traders. Reports suggest that President Trump was considering sending the US-made Tomahawk long-range cruise missiles to Ukraine to pressure Russian President Vladimir Putin into negotiations. This keeps geopolitical risks in play and is another factor contributing to the weakness in the Bitcoin price.
US government shutdown continues
The ongoing US government shutdown, which began on October 1, deepened on Tuesday after the Republican-backed stopgap funding bill failed to pass in the Senate. This signals that the deadlock will likely extend into a third week with no resolution in sight.
The shutdown is limiting new economic data releases, and the clarity on the interest rate outlook for October remains clouded. However, Federal Reserve Chair Jerome Powell did not provide specific guidance on interest rates on Tuesday, though comments about weakness in the labor market suggested that further easing is firmly on the table. Moreover, other Fed officials have pointed to the likelihood of additional rate cuts moving ahead.
Additionally, the ongoing government shutdown has delayed the approval of several pending altcoin ETF applications, which were expected to launch in October. This delay potentially postpones a key catalyst that could have shifted overall crypto market sentiment.
Given the delay in macroeconomic data, the market focus will remain glued to speeches from influential Federal Open Market Committee (FOMC) members. This would play a key role in driving the USD demand, which, along with trade developments, should provide some impetus to riskier assets such as Bitcoin.
Some signs of optimism
Following the massive liquidity flush and deleveraging event on Friday, when Bitcoin plunged from a daily high of $122,550 to a low of $102,000, a K33 report released on Tuesday suggests that the coming weeks could present an opportune window for capital deployment into BTC, as the reset in perpetual markets and normalization of funding dynamics may lay the groundwork for renewed upside momentum.
The graph below shows that Binance’s BTC/USDT perpetual contract is trading at a record 5.1% discount to spot, the widest deviation since March 13, 2020. The Friday crash wiped out four months of built-up perpetual leverage, with open interest plunging over 50,000 BTC to Q2 lows and funding rates turning deeply negative.
“While sentiment flipped sharply bearish, this broad deleveraging is healthy, reducing the risk of further long squeezes and setting a cleaner base for recovery,” said K33 analyst.
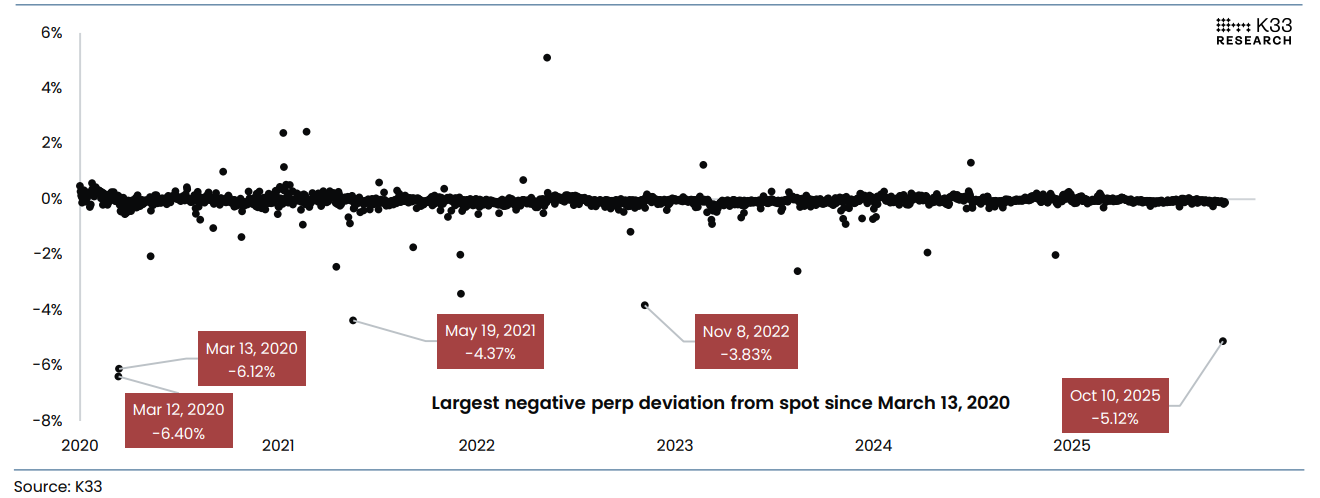
Percentage Difference in daily low of Binance’s BTCUSDT Perp vs. Coinbase BTCUSD spot chart. Source: K33 Research
However, the analyst concluded that after the recent leverage purge, the outlook on BTC becomes constructively bullish, though patience remains key. Structural effects from the unwind mean liquidity will likely stay thin as market participants recover from forced selling. Historically, such deleveraging phases lead to short-term stagnation and cautious trading, but they also tend to mark exhaustion points, creating fertile ground for longer-term recovery once stability returns.
“Combined with a supportive backdrop, including expansionary policy expectations, high institutional demand, and pending ETF catalysts, the setup favors gradual accumulation. We finally see current levels as attractive for increasing spot BTC exposure, as leverage has been violently cleared.”
Bitcoin Price Forecast: BTC CME gap gets filled
The BTC futures 4-hour chart on the Chicago Mercantile Exchange (CME) shows that the gap between $110,990 and $111,355 — created during weekend trading on September 27-28 — was filled on Tuesday. Historically, Bitcoin tends to fill such CME gaps, as explained in a previous report, before continuing its broader trend. This suggests that BTC could now be positioned to resume its recovery and upward trend.
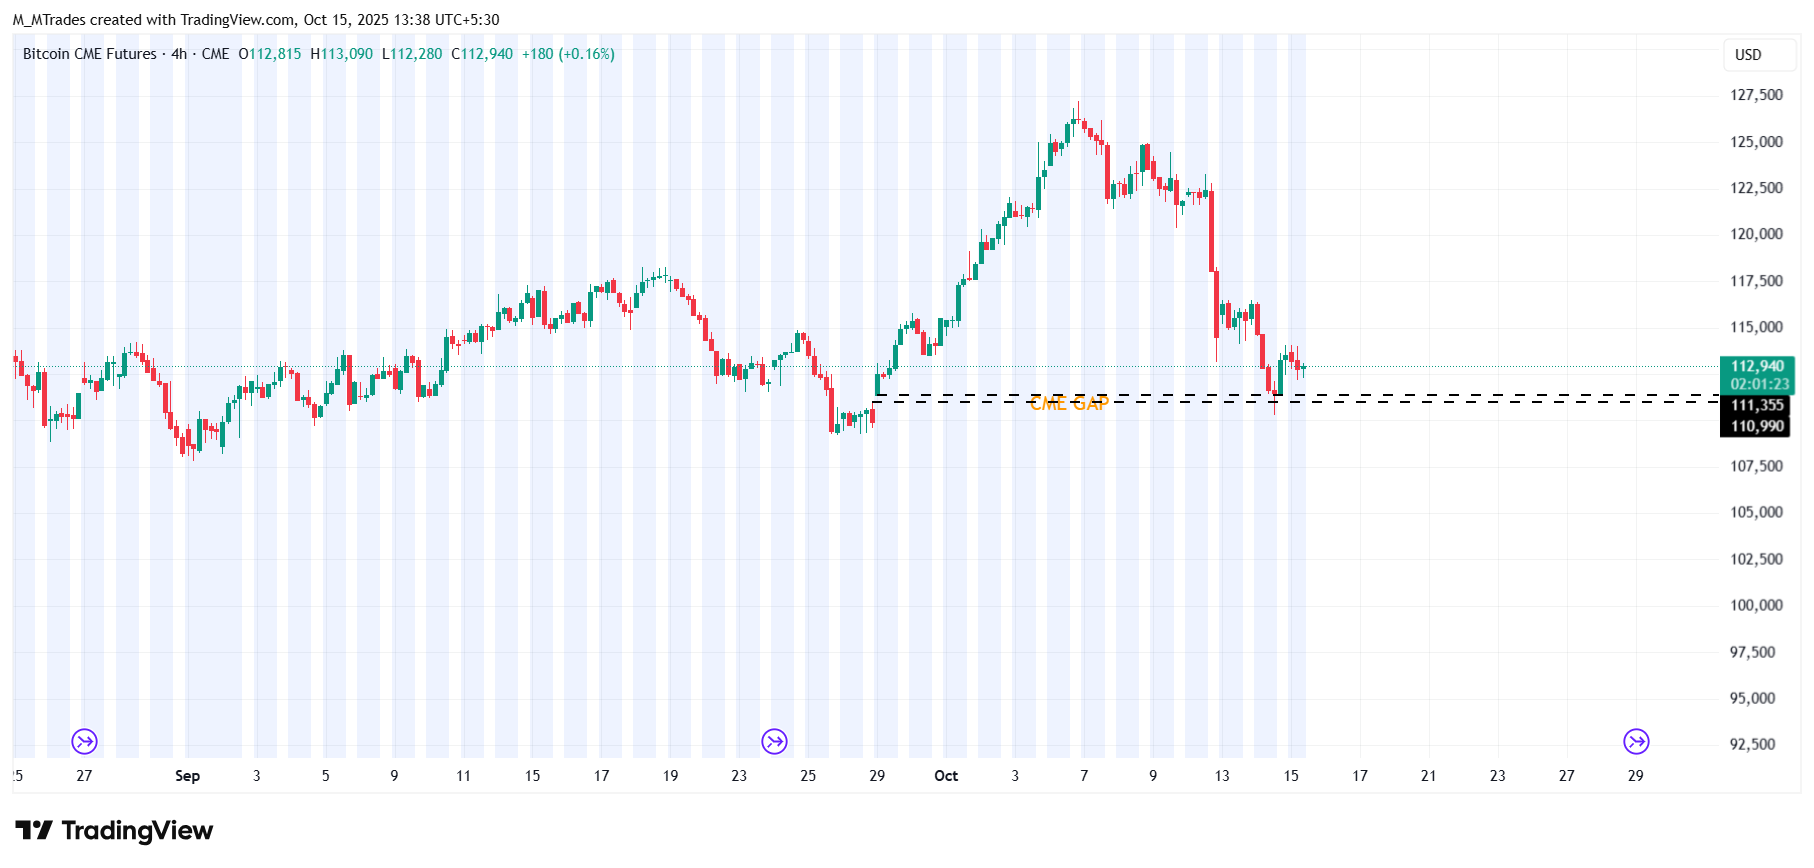
BTC CME 4-hour chart
On the daily chart, Bitcoin price recovered slightly on Sunday and closed above $114,900 after the sharp fall on Friday. BTC continued its recovery on Monday and retested the 78.6% Fibonacci retracement level at $115,137 (drawn from the April low of $74,508 to the October 6 high of $126,199). This level roughly coincides with the 50-day Exponential Moving Average (EMA) at $115,400, making it a key resistance zone. On Tuesday, BTC declined by 1.86% after retesting the resistance zone, but found support around the ascending trendline. At the time of writing on Wednesday, it hovers around $112,300.
If BTC continues its correction, it could extend the decline toward the daily support level at $107,245.
The Relative Strength Index (RSI) reads 42 on the daily chart, which is below its neutral level of 50, indicating bearish momentum is gaining traction. Additionally, the Moving Average Convergence Divergence (MACD) showed a bearish crossover on Friday, which still holds, further supporting the bearish view.
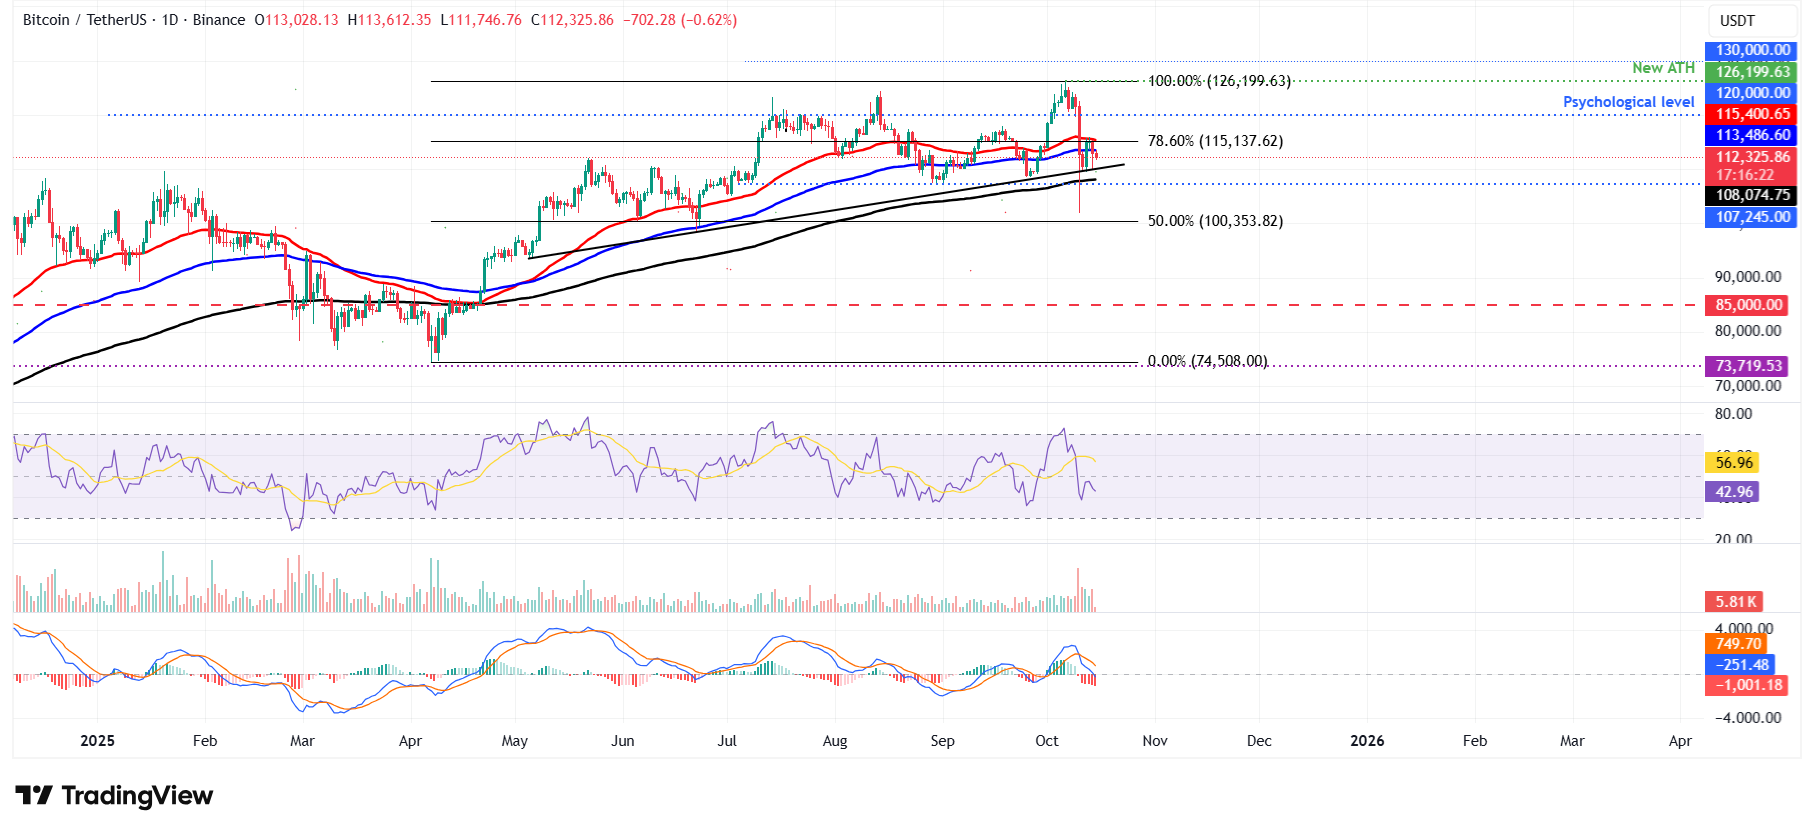
BTC/USDT daily chart
On the other side, if BTC recovers, it could extend the recovery toward the 50-day EMA at $115,400.
Read more
* The content presented above, whether from a third party or not, is considered as general advice only. This article should not be construed as containing investment advice, investment recommendations, an offer of or solicitation for any transactions in financial instruments.


