
Ethereum (ETH) Dips 7% As Key Indicators Remain Bearish
Ethereum (ETH) dipped over 7% in the last 24 hours despite Trump’s 90-day tariff pause. Key technical indicators suggest that a full trend reversal might be unlikely in the short term.
The BBTrend remains strongly negative, and whale accumulation has stalled, both signaling caution. Combined with a still-bearish EMA structure, Ethereum may need a stronger wave of buying pressure before it can break out of its current downtrend.
ETH BBTrend Is Strongly Negative But Bigger Than Yesterday
Ethereum’s BBTrend indicator has slightly improved, currently reading -18, up from -21.59 just before Trump’s tariff pause announcement.
This shift suggests that bearish momentum may be starting to fade, although it still signals overall downside pressure. The BBTrend (Band-Based Trend) is a volatility-based indicator that helps gauge the strength and direction of a trend using the relationship between price and Bollinger Bands.
Values above zero indicate bullish momentum, while negative values point to bearish trends—the further from zero, the stronger the directional conviction.
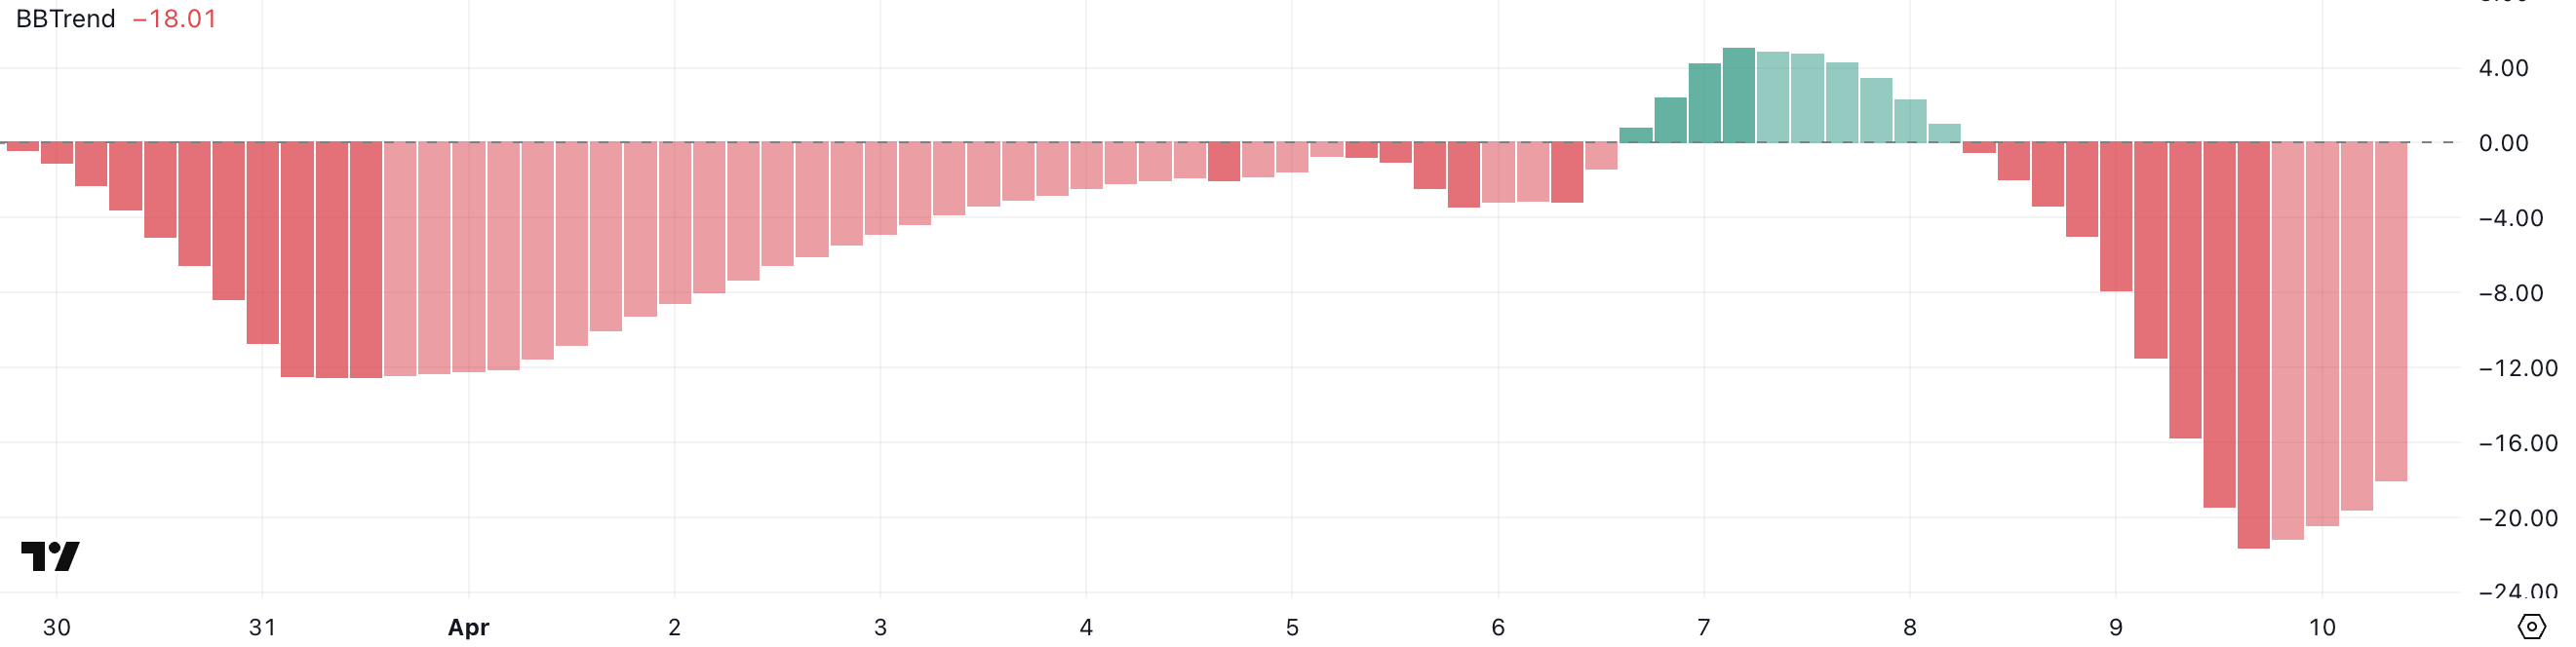 ETH BBTrend. Source: TradingView.
ETH’s BBTrend has remained in negative territory since April 8, reflecting sustained weakness in recent sessions. While the recent uptick could hint at early stabilization, the current value of -18 suggests Ethereum hasn’t yet flipped the broader trend.
For bullish confirmation, ETH would need to push BBTrend back toward neutral or positive territory, ideally supported by volume and strong price action.
Until then, the chart points to a market still in correction mode but with some signs of possible reversal ahead.
Whales Are Still Not Accumulating
The number of Ethereum whales—wallets holding between 1,000 and 10,000 ETH—rose from 5,340 to 5,382 between April 5 and 6, marking a brief uptick in accumulation.
However, the metric has since stabilized and currently sits at 5,376, showing little change in recent days.
Tracking whale activity is critical because these large holders often have the influence to move markets, either by initiating big buys during dips or selling into strength to take profits.
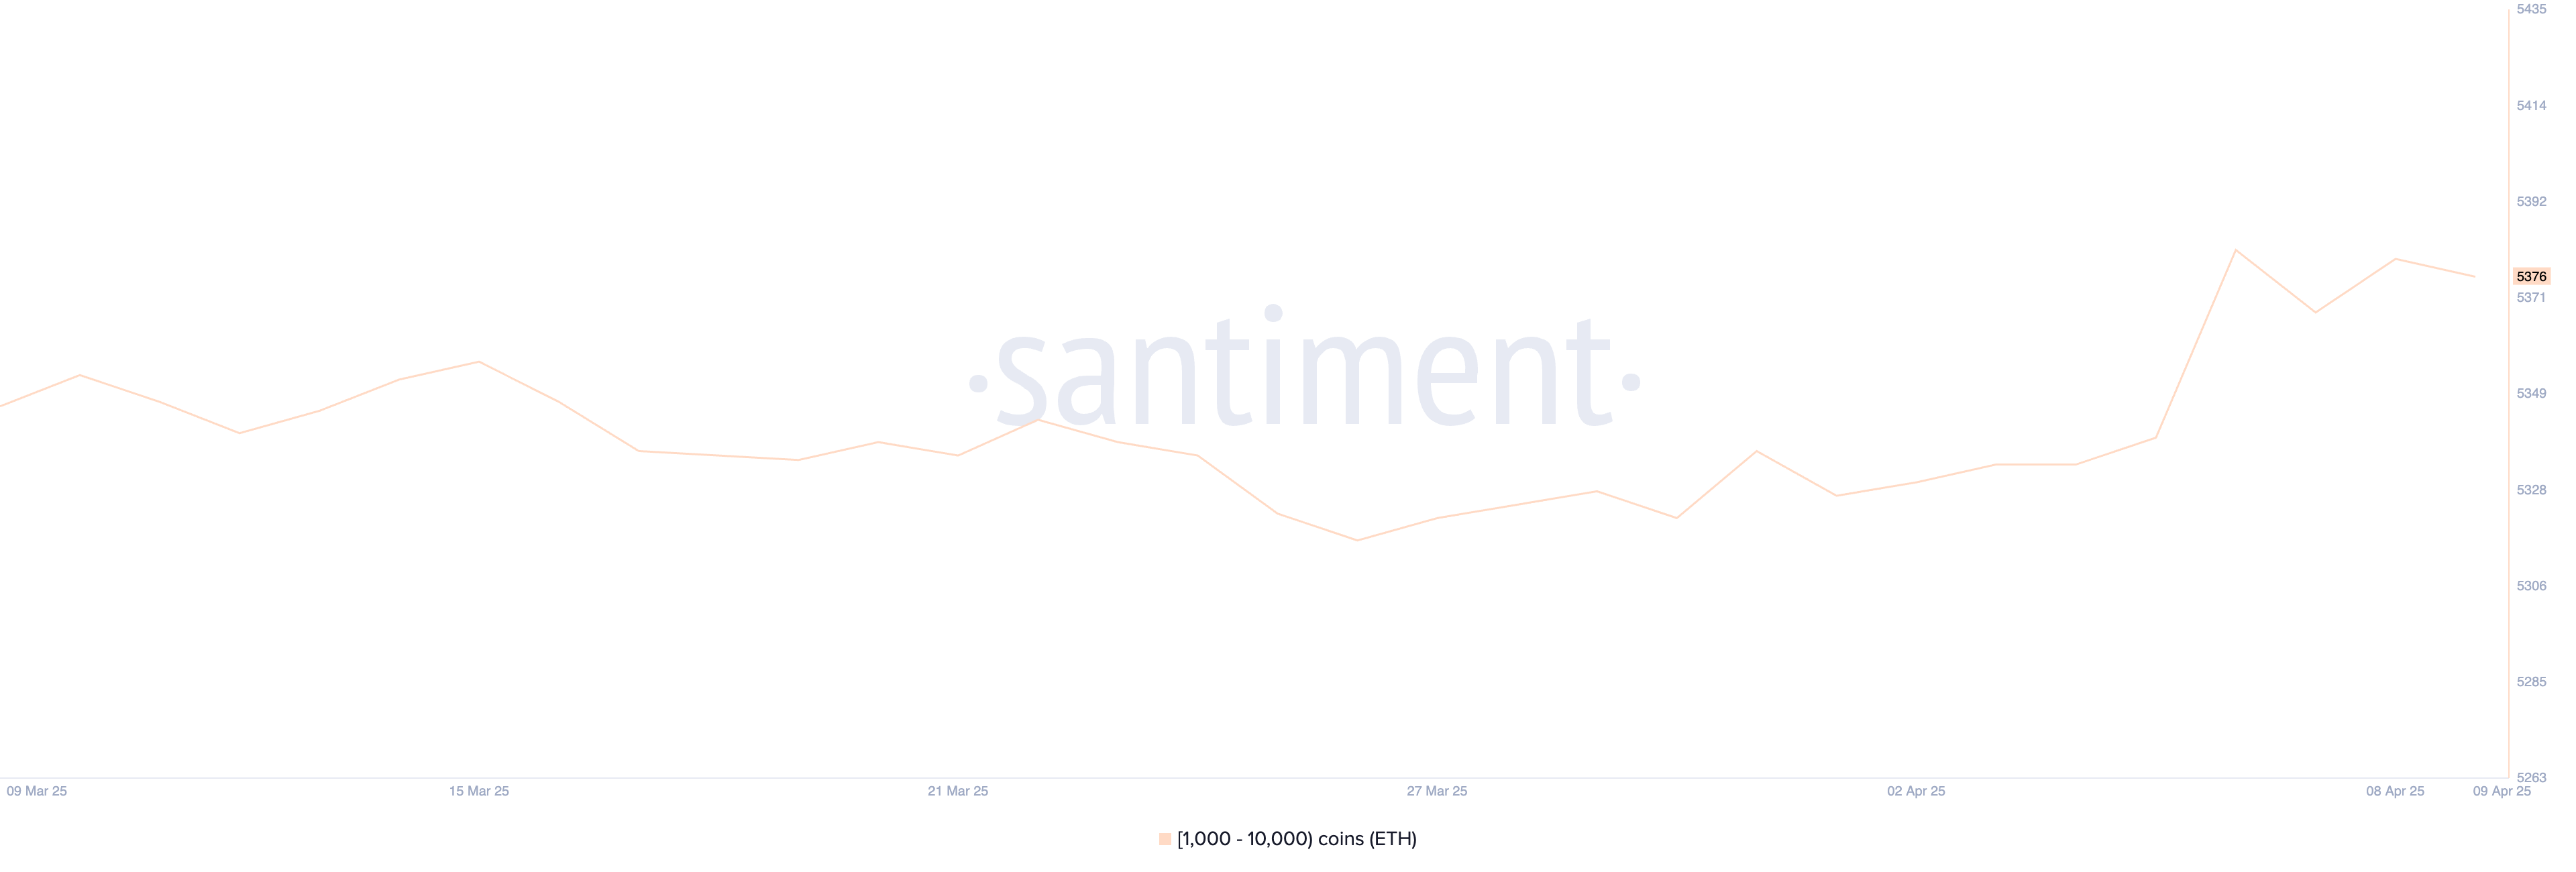 Ethereum Whales. Source: Santiment.
The recent stabilization in whale numbers suggests a wait-and-see approach from major holders. After a brief accumulation spike, whales appear to be holding their positions rather than aggressively buying or selling.
This could mean that confidence is returning but not yet strong enough to fuel a major breakout.
For Ethereum to see sustained upward momentum, a renewed rise in whale accumulation would be a positive signal, indicating growing conviction from the largest players in the market.
Is The Current Ethereum Surge Just Temporary?
Despite Ethereum’s recent bounce following Trump’s tariff pause, its EMA structure remains bearish, with short-term moving averages still positioned below the longer-term ones.
This lagging alignment typically reflects continued downside pressure, even during relief rallies.
When viewed alongside other indicators—like the still-negative BBTrend and stagnant whale accumulation—it becomes clear that Ethereum needs significantly more buying volume to shift into a confirmed uptrend.
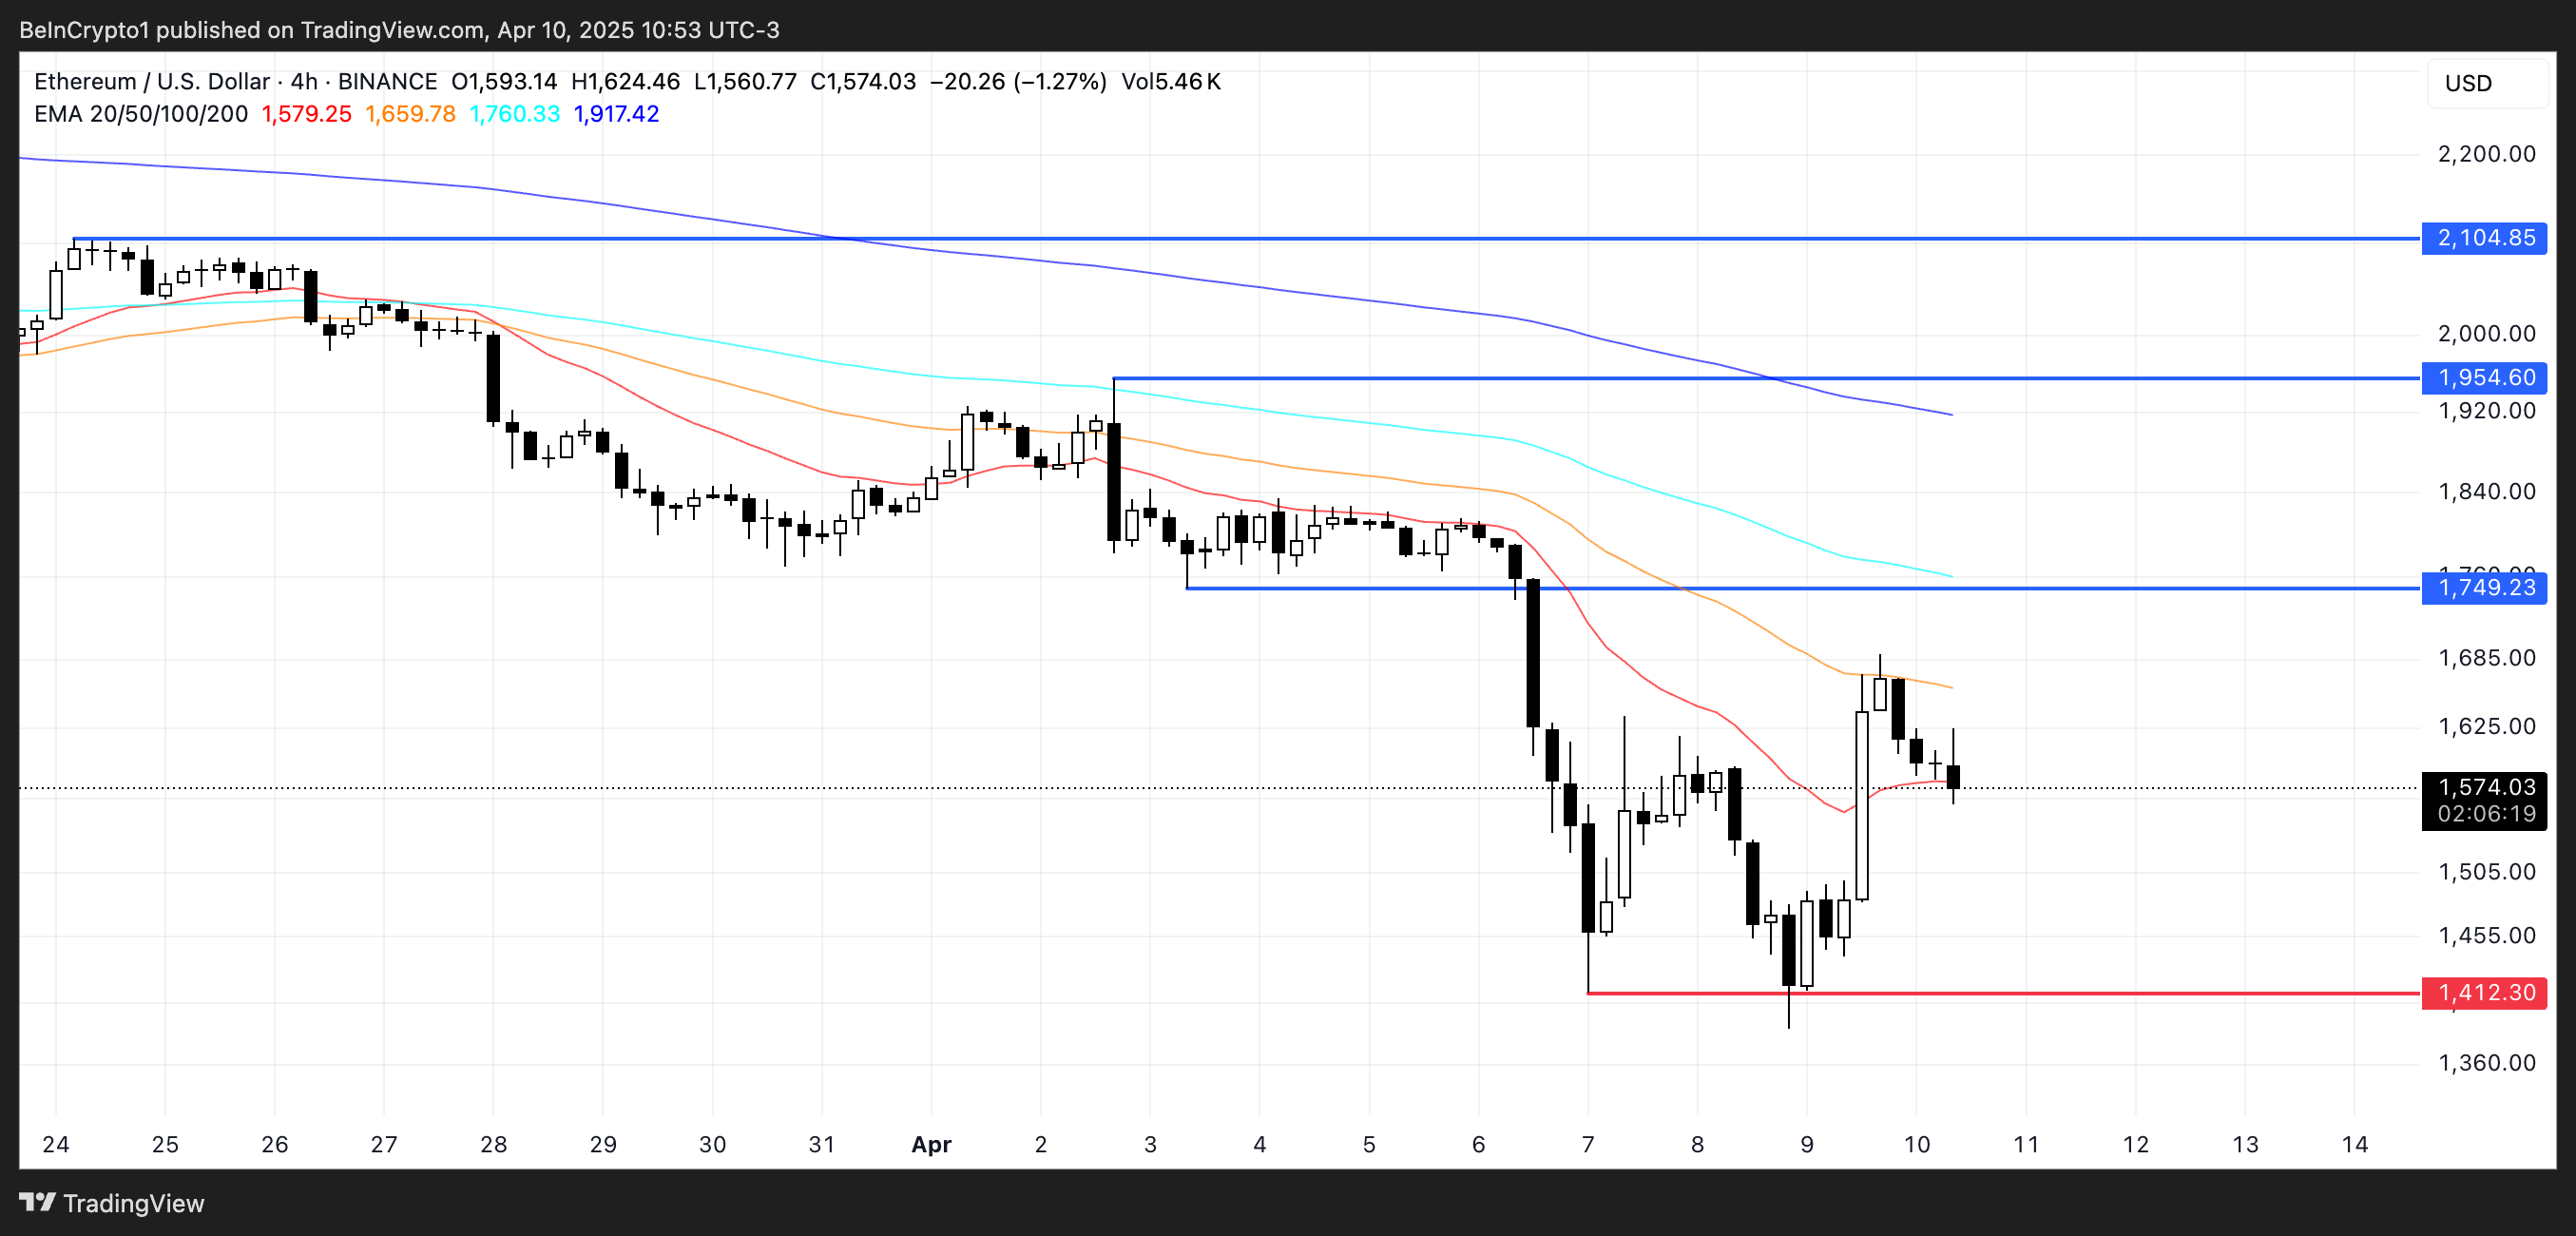 ETH Price Analysis. Source: TradingView.
If that bullish pressure does emerge, Ethereum’s price could aim to test resistance at $1,749, and a breakout there could open the path to $1,954 and even $2,104. That could be driven by macro developments, like the SEC’s recent approval of options trading on BlackRock’s Ethereum ETF.
However, if momentum fades, the price risks entering another correction phase.
Key support lies at $1,412, and if that level fails, ETH could slip below $1,400 and potentially revisit sub-$1,300 territory.
Recommended Articles


