XRP Signals Potential Market Bottom as Short-Term Holders Witness Capitulation

Source Beincrypto

XRP has faced a long downturn, shedding 46% of its value since reaching an all-time high of $3.40 on January 16

This decline has pushed many holders—particularly short-term investors—into losses, sparking concerns over further downside. However, on-chain data now points to a potential shift in sentiment. This analysis holds the details.

XRP Short-Term Holders Sell at a Loss

According to the readings from XRP’s Short-Term Holder Net Unrealized Profit/Loss (STH-NUPL) metric, capitulation is underway.

Short-term holders are investors who have held their assets for less than 155 days. This group of XRP holders experiences capitulation when they begin to sell their assets at a loss, often driven by panic or exhaustion. At press time, XRP’s STH-NUPL is at its year-to-date low of -0.13. 

XRP Short Term Holder NUPL.
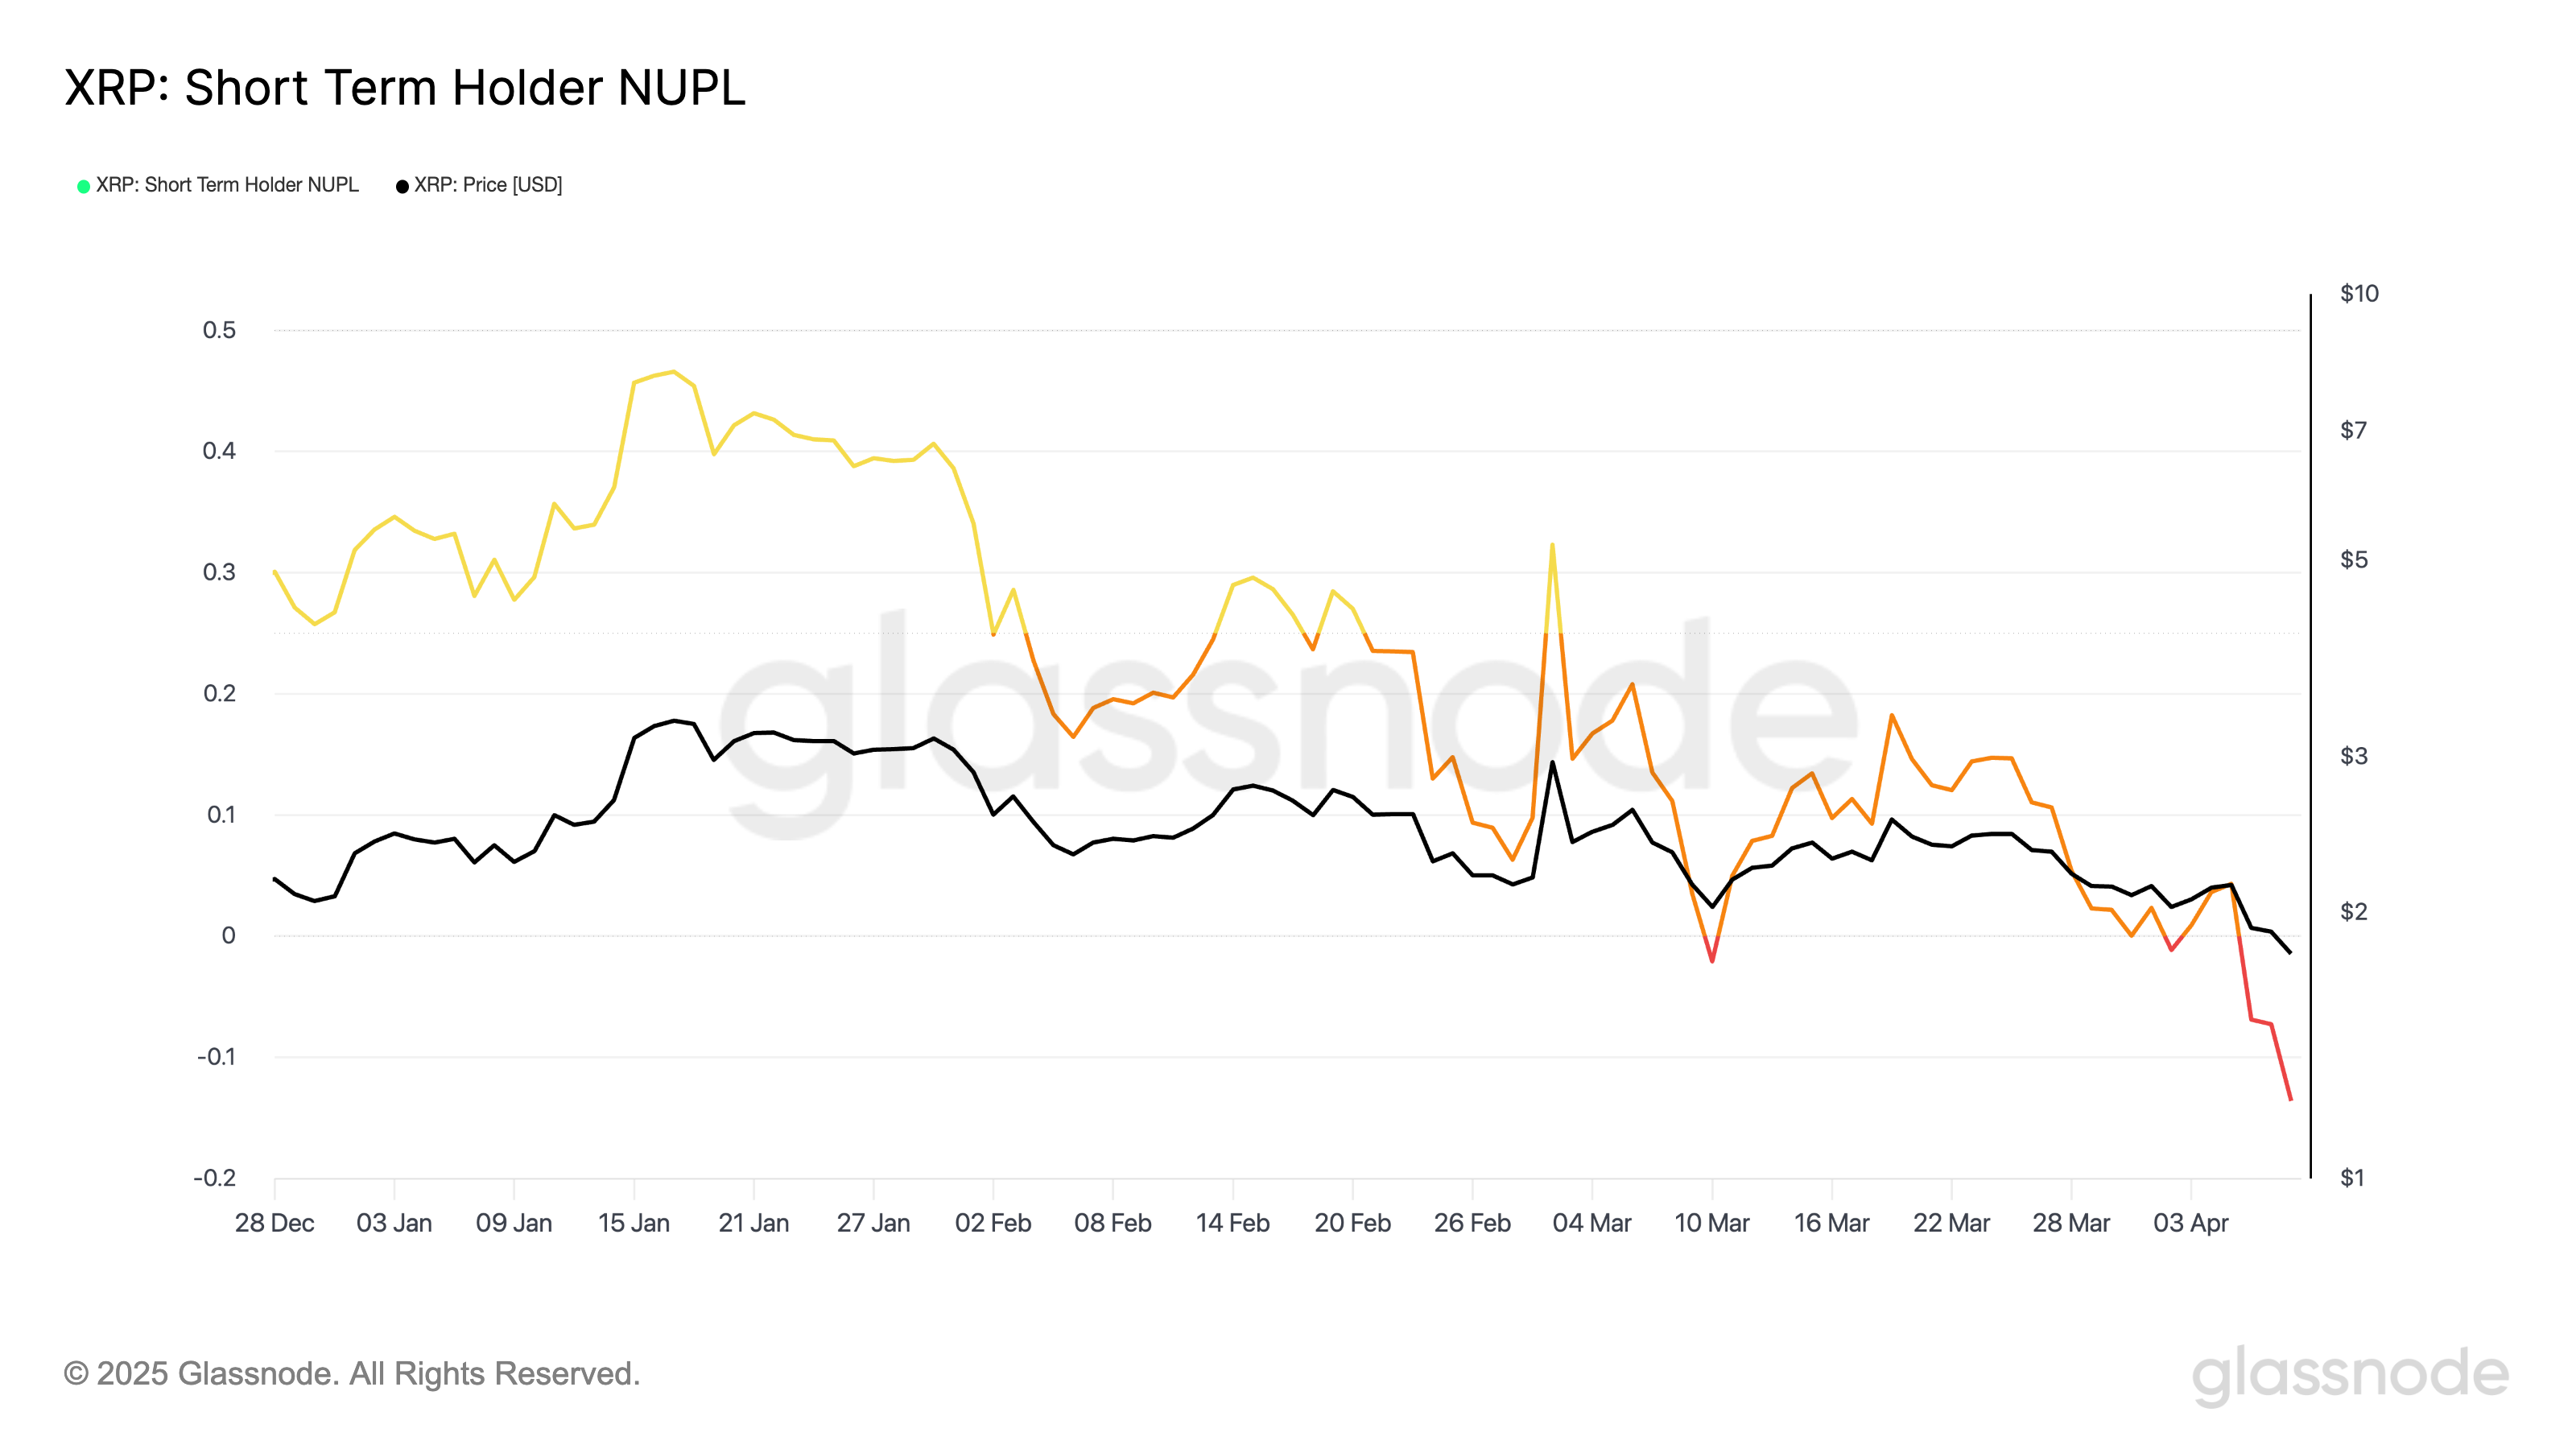
XRP Short Term Holder NUPL. Source: Glassnode

This means that many XRP STHs are recording their highest unrealized losses of the year. It suggests that many recent buyers are now underwater, which could potentially worsen the downward pressure on the token’s price.

However, there is a catch. Historically, STH capitulation like this has been observed near market bottoms and can signal a bullish reversal. This indicates that “weak hands” are exiting the market, making way for “diamond hands” that can trigger a bullish trend reversal. 

XRP’s nearly oversold state confirms this positive outlook. At press time, the altcoin’s Relative Strength Index (RSI) is poised to fall below 30, usually marked by sellers’ exhaustion. 

XRP RSI
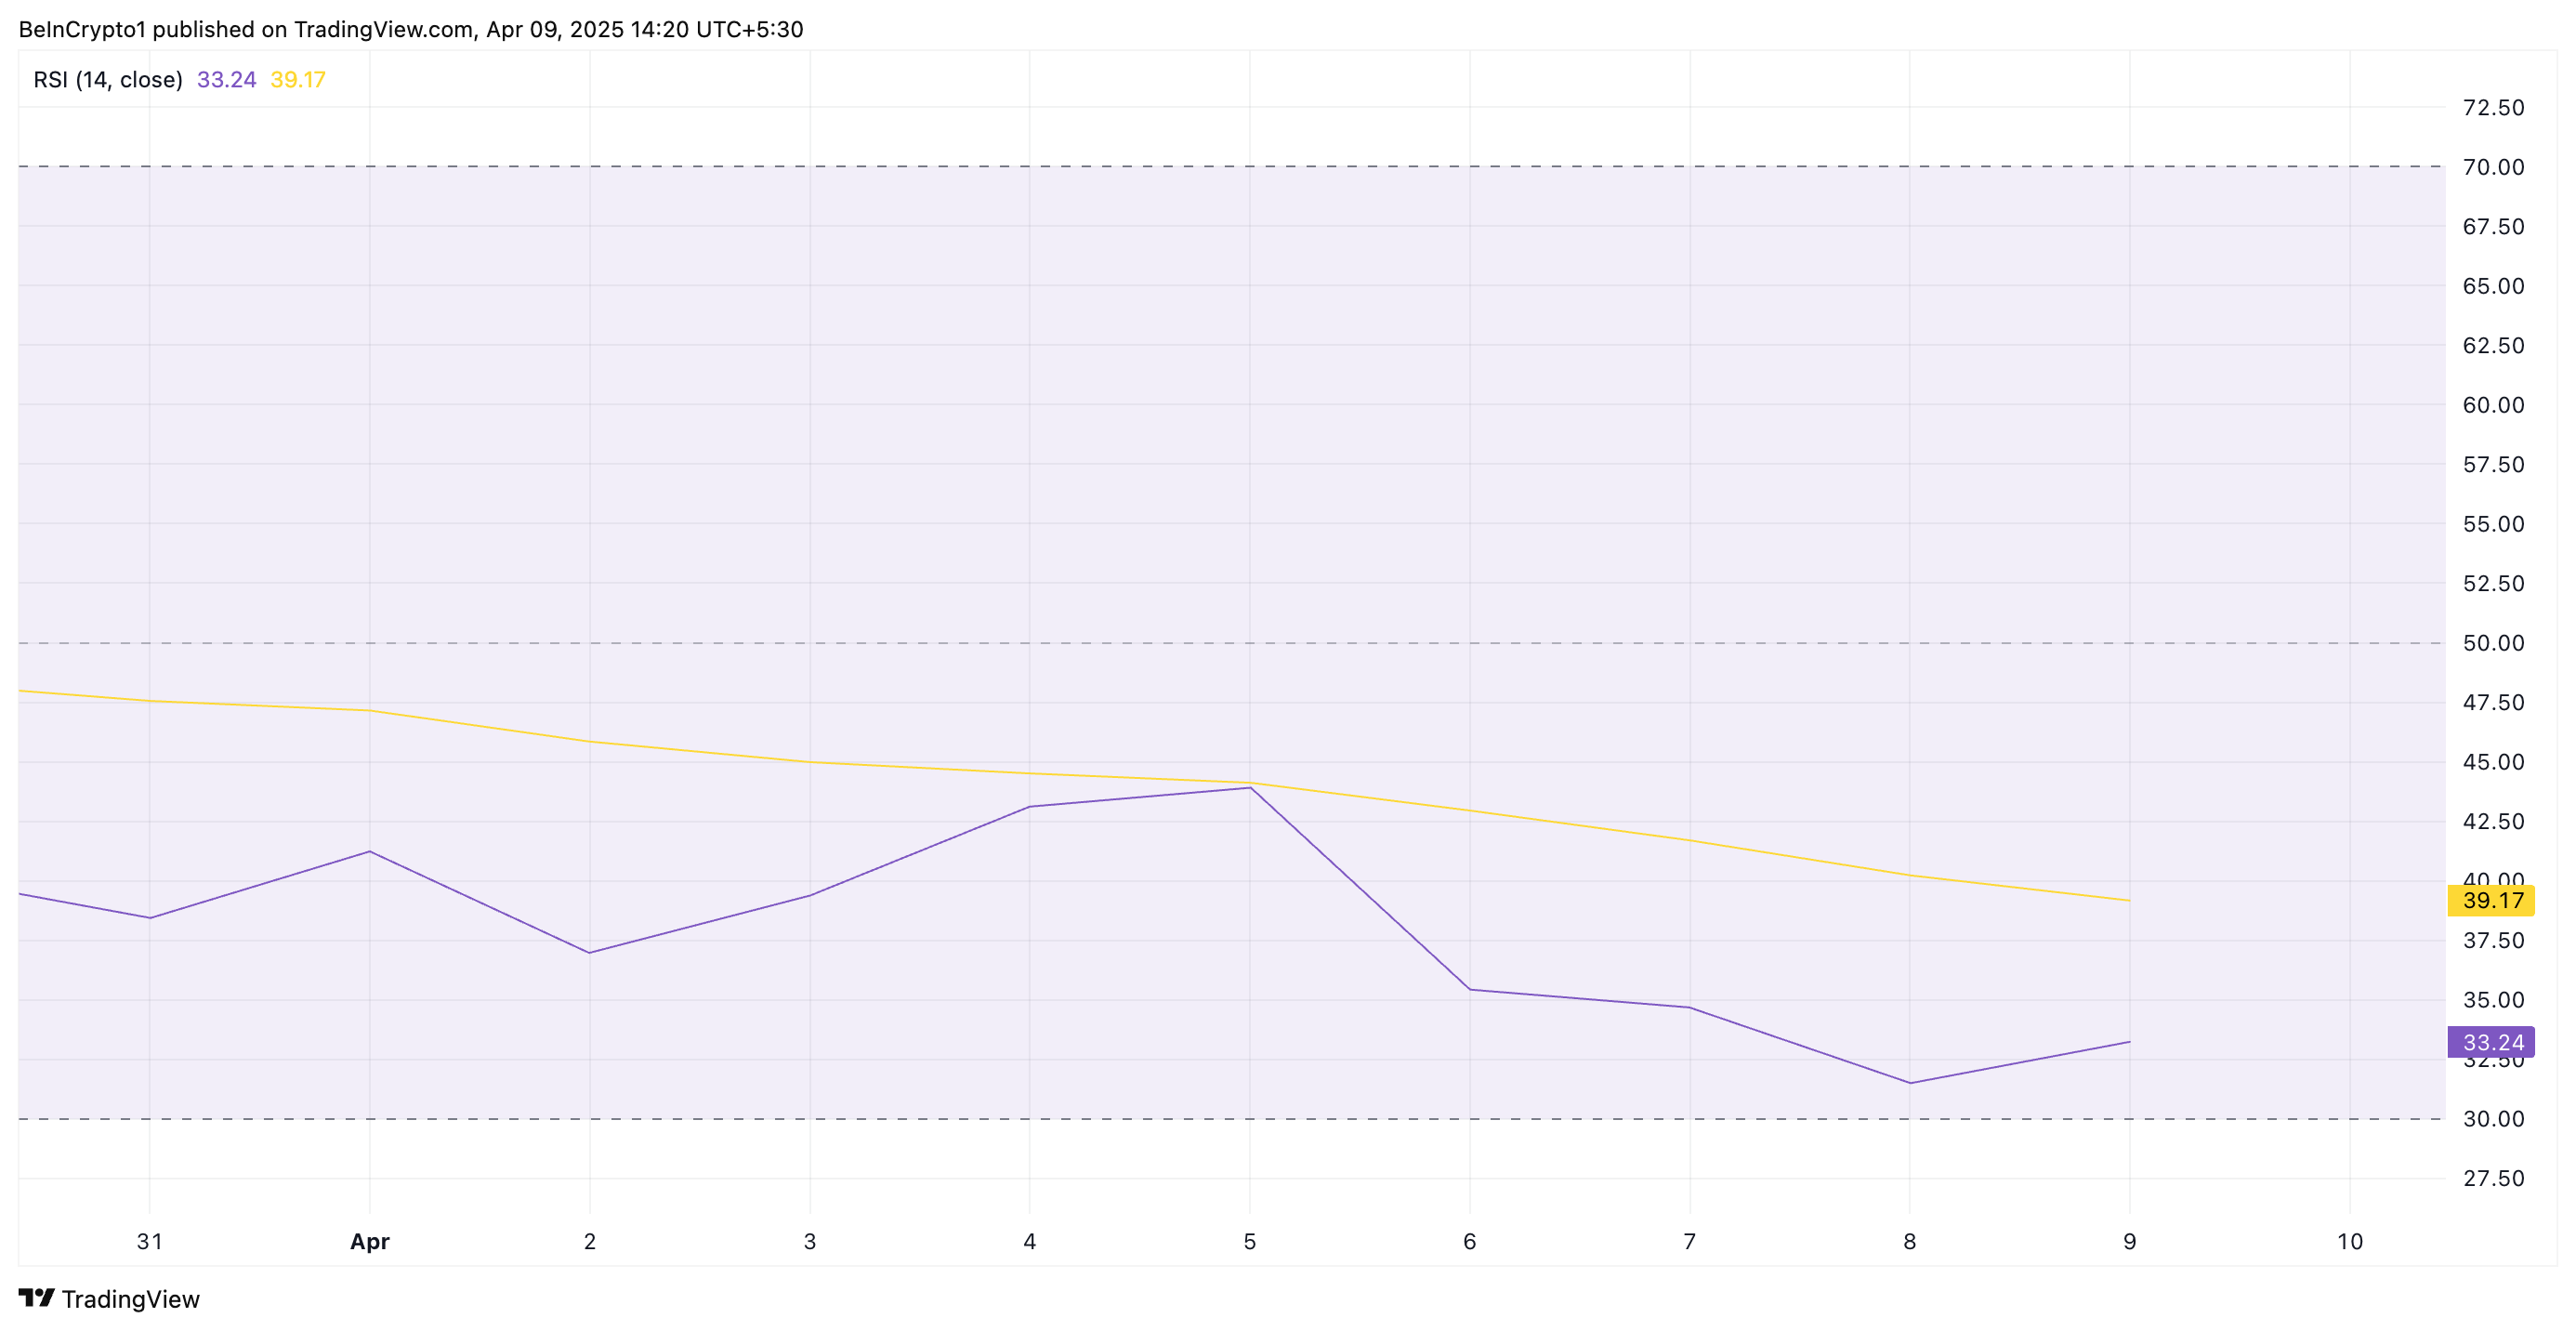
XRP RSI. Source: TradingView

The RSI indicator measures an asset’s overbought and oversold market conditions. It ranges between 0 and 100. Values above 70 suggest that the asset is overbought and due for a price decline, while values under 30 indicate that the asset is oversold and may witness a rebound.

Once XRP becomes oversold, its sellers experience exhaustion, creating a buying opportunity for those looking to accumulate the currently undervalued altcoin. 

XRP Maintains a Bearish Structure

On the daily chart, XRP remains within its descending parallel channel. The token has trended within this bearish signal since January 16, depicting its steady price decline.

When an asset lingers within a descending parallel channel, it indicates a sustained downtrend with lower highs and lower lows. It signals continued bearish momentum in the XRP market and hints at the likelihood of a decline toward $1.61. 

XRP Price Analysis
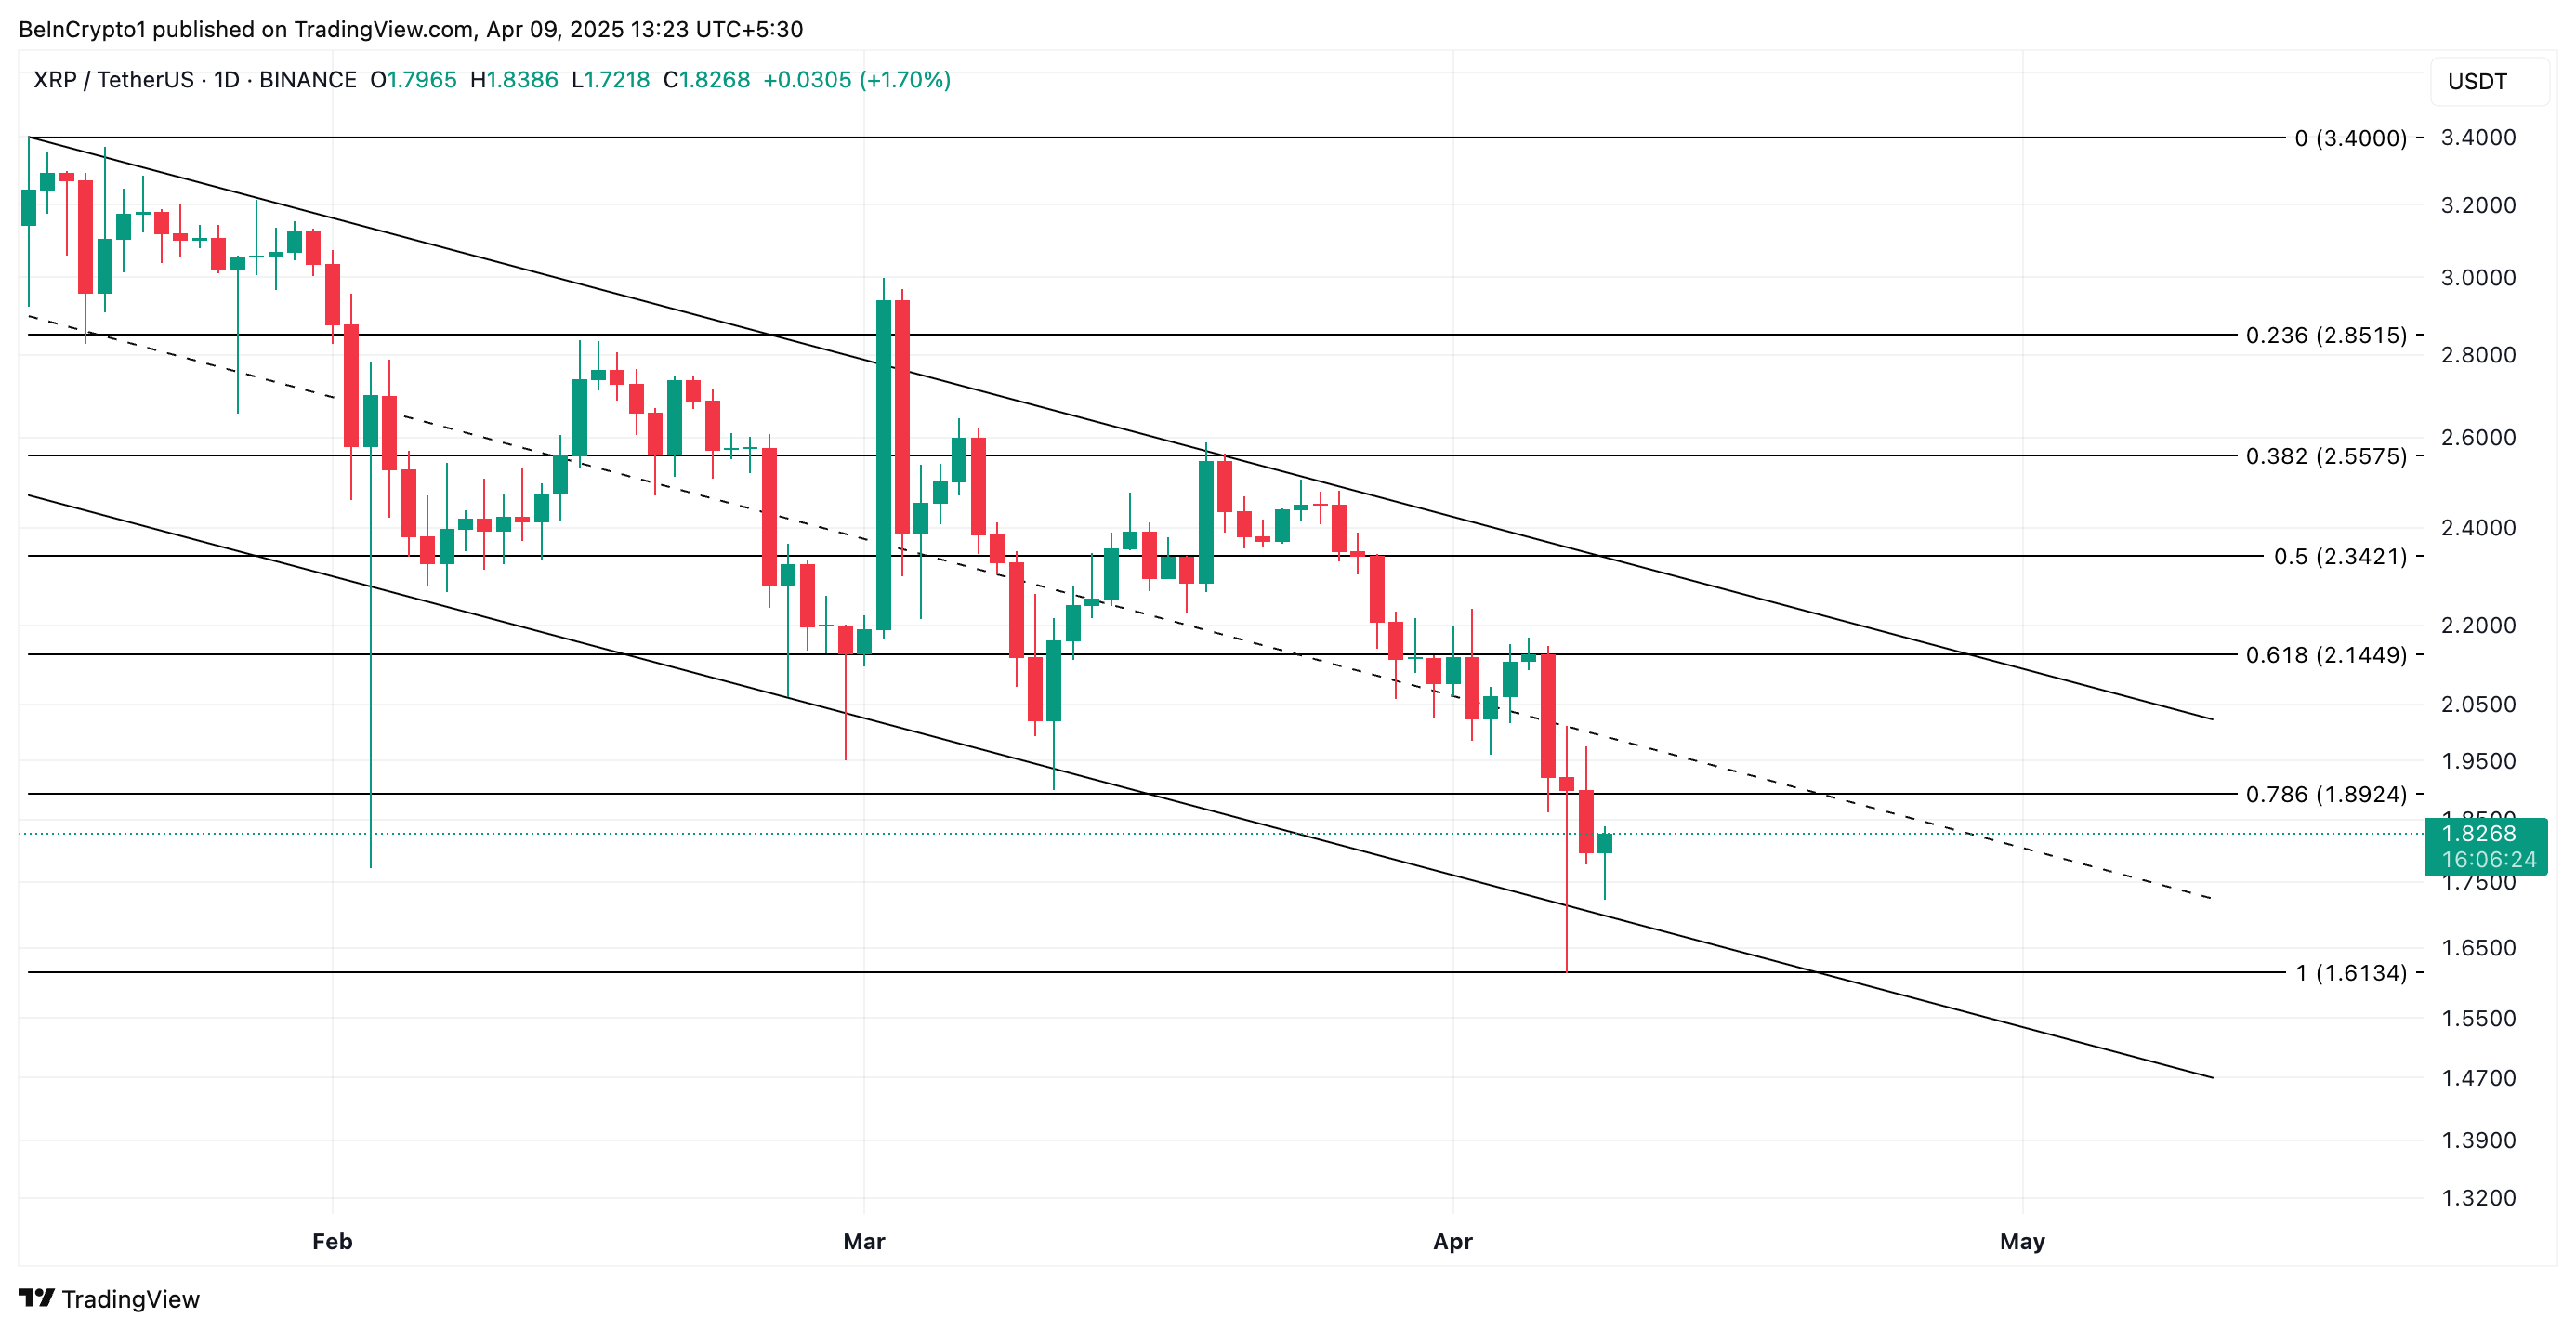
XRP Price Analysis. Source: TradingView

However, if new demand enters the market once XRP becomes oversold, it could prompt a rebound toward $1.89.

Disclaimer: For information purposes only. Past performance is not indicative of future results.
placeholder
A Crash After a Surge: Why Silver Lost 40% in a Week?TradingKey - Spot Silver ( XAGUSD) prices have continued to decline; on Thursday, silver plummeted as much as 20% to break below $71 per ounce, and on Friday the sell-off intensified as prices fell fu
Author  TradingKey
Feb 06, Fri
TradingKey - Spot Silver ( XAGUSD) prices have continued to decline; on Thursday, silver plummeted as much as 20% to break below $71 per ounce, and on Friday the sell-off intensified as prices fell fu
placeholder
Bitcoin is trading around $63,000, down nearly 40% from its peak near $126,000Wall Street desks are no longer talking about upside dreams. The talk right now is how far Bitcoin charts could fall if selling keeps piling up. According to data from TradingView, Bitcoin’s price now sits at a shocking $63,500, after falling from $70,000 just this morning, losing $13,000 in 6 days, and staying far below […]
Author  Cryptopolitan
Feb 06, Fri
Wall Street desks are no longer talking about upside dreams. The talk right now is how far Bitcoin charts could fall if selling keeps piling up. According to data from TradingView, Bitcoin’s price now sits at a shocking $63,500, after falling from $70,000 just this morning, losing $13,000 in 6 days, and staying far below […]
placeholder
WTI declines below $63.00 as US-Iran talks loom West Texas Intermediate (WTI), the US crude oil benchmark, is trading around $62.85 during the Asian trading hours on Friday. The WTI price declines after the United States (US) and Iran agreed to hold talks in Oman on Friday. 
Author  FXStreet
Feb 06, Fri
West Texas Intermediate (WTI), the US crude oil benchmark, is trading around $62.85 during the Asian trading hours on Friday. The WTI price declines after the United States (US) and Iran agreed to hold talks in Oman on Friday. 
placeholder
Bitcoin Surrenders $65,000 as Analysts Warn of ‘Structural’ Market BreakBitcoin plunges 11% to break $65k as analysts term the crash "structural," citing a $1 trillion market wipeout and $2.09 billion in daily liquidations.
Author  Mitrade
Feb 06, Fri
Bitcoin plunges 11% to break $65k as analysts term the crash "structural," citing a $1 trillion market wipeout and $2.09 billion in daily liquidations.
placeholder
Bitcoin Drops to $70,000. U.S. Government Refuses to Bail Out Market, End of Bull Market or Golden Pit? The U.S. government refuses to bail out Bitcoin, and with Fed rate cuts nowhere in sight, a continued downward trend to test for a bottom is likely after a brief rebound.During the mid-da
Author  TradingKey
Feb 05, Thu
The U.S. government refuses to bail out Bitcoin, and with Fed rate cuts nowhere in sight, a continued downward trend to test for a bottom is likely after a brief rebound.During the mid-da
goTop
quote