


Will Ethereum (ETH) Price Fall to $1,000 in April?
Ethereum (ETH) is down almost 6% in the last 24 hours, intensifying a week of sharp declines. With the price below $1,500, market watchers are increasingly questioning whether ETH could fall to $1,000 in April.
Mounting concerns around liquidations, declining network activity, and bearish technicals are fueling the debate. As investor sentiment wavers, the next few days could prove critical for Ethereum’s short-term trajectory.
If ETH Falls Below $1200, Nearly $342 Million Will Be Liquidated
Ethereum is currently hovering just above the $1,500 mark, down more than 15% over the past week as bearish pressure intensifies across the crypto market.
The recent downturn has sparked concern among traders, especially with ETH struggling to hold key support levels. Standard Chartered recently stated that XRP could overtake Ethereum by 2028.
The decline reflects broader risk-off sentiment and uncertainty surrounding altcoins, with Ethereum now teetering dangerously close to levels that could trigger a major wave of liquidations.
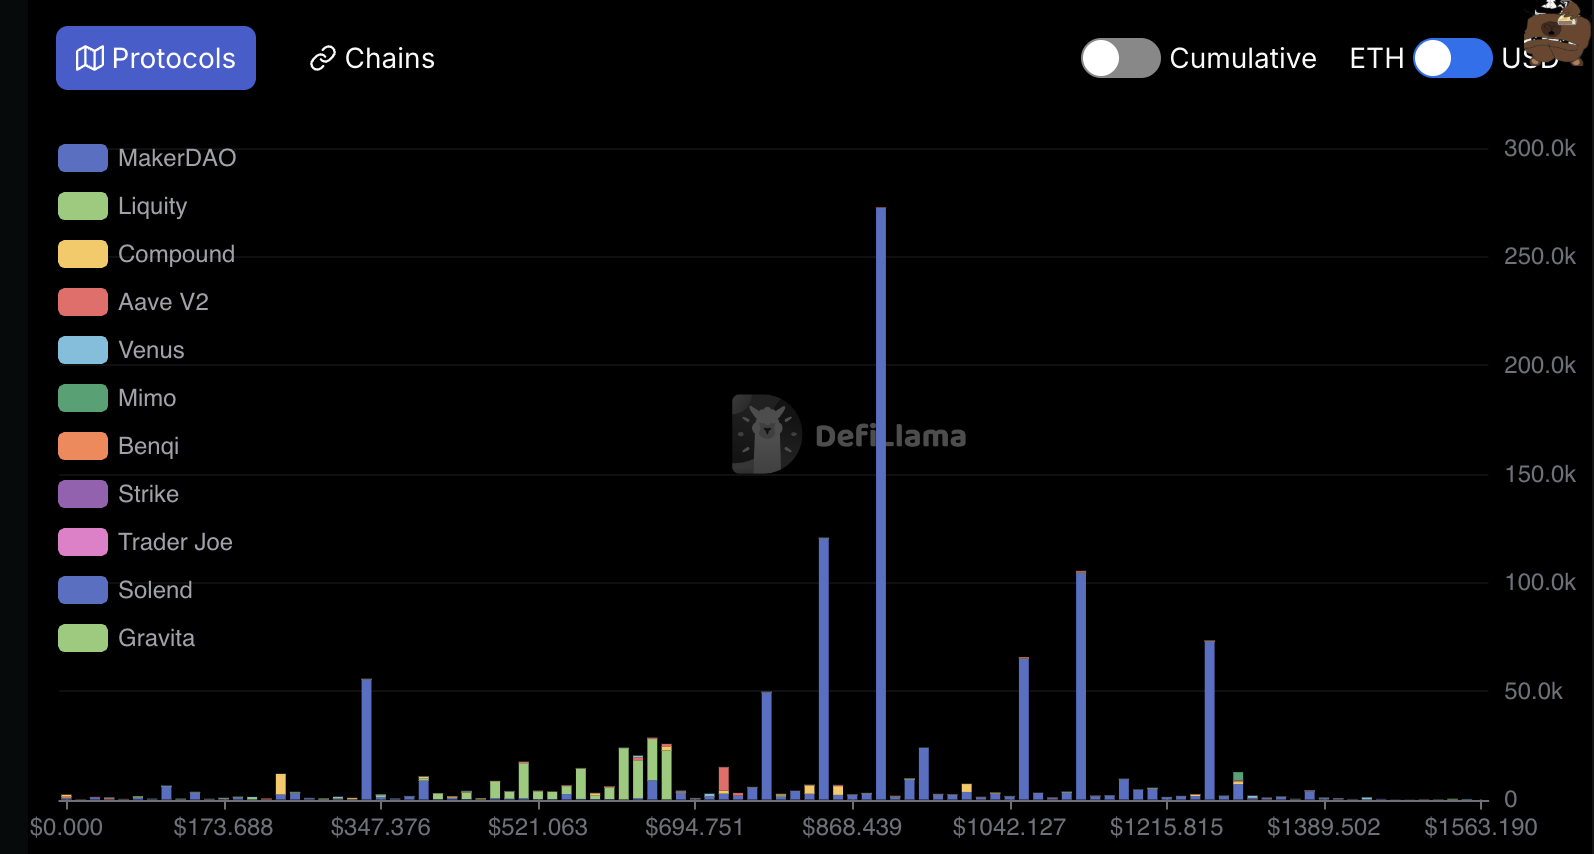 Ethereum Liquidations. Source: DeFiLlama.
According to on-chain data, if ETH falls below $1,200, it could trigger liquidations totaling approximately $342 million across leveraged positions.
Liquidation occurs when traders who borrowed capital to go long on Ethereum are forced to sell their holdings due to falling prices. This effectively amplifies the downside and adds more selling pressure.
Weighing in on the situation, investor Peter Schiff took to X, warning that he doesn’t think it will take long before Ethereum crashes below $1,000 — a level not seen since January 2021.
Ethereum TVL Is Down 43% Since December
Ethereum’s total value locked (TVL) has been in sharp decline since peaking at $86.6 billion in December — its highest level since mid-2022.
As of now, Ethereum’s TVL has dropped to $49.34 billion, marking a steep 43% decrease in just a few months.
This decline highlights waning user activity and capital outflows from Ethereum-based protocols, raising fresh concerns about the network’s short-term momentum.
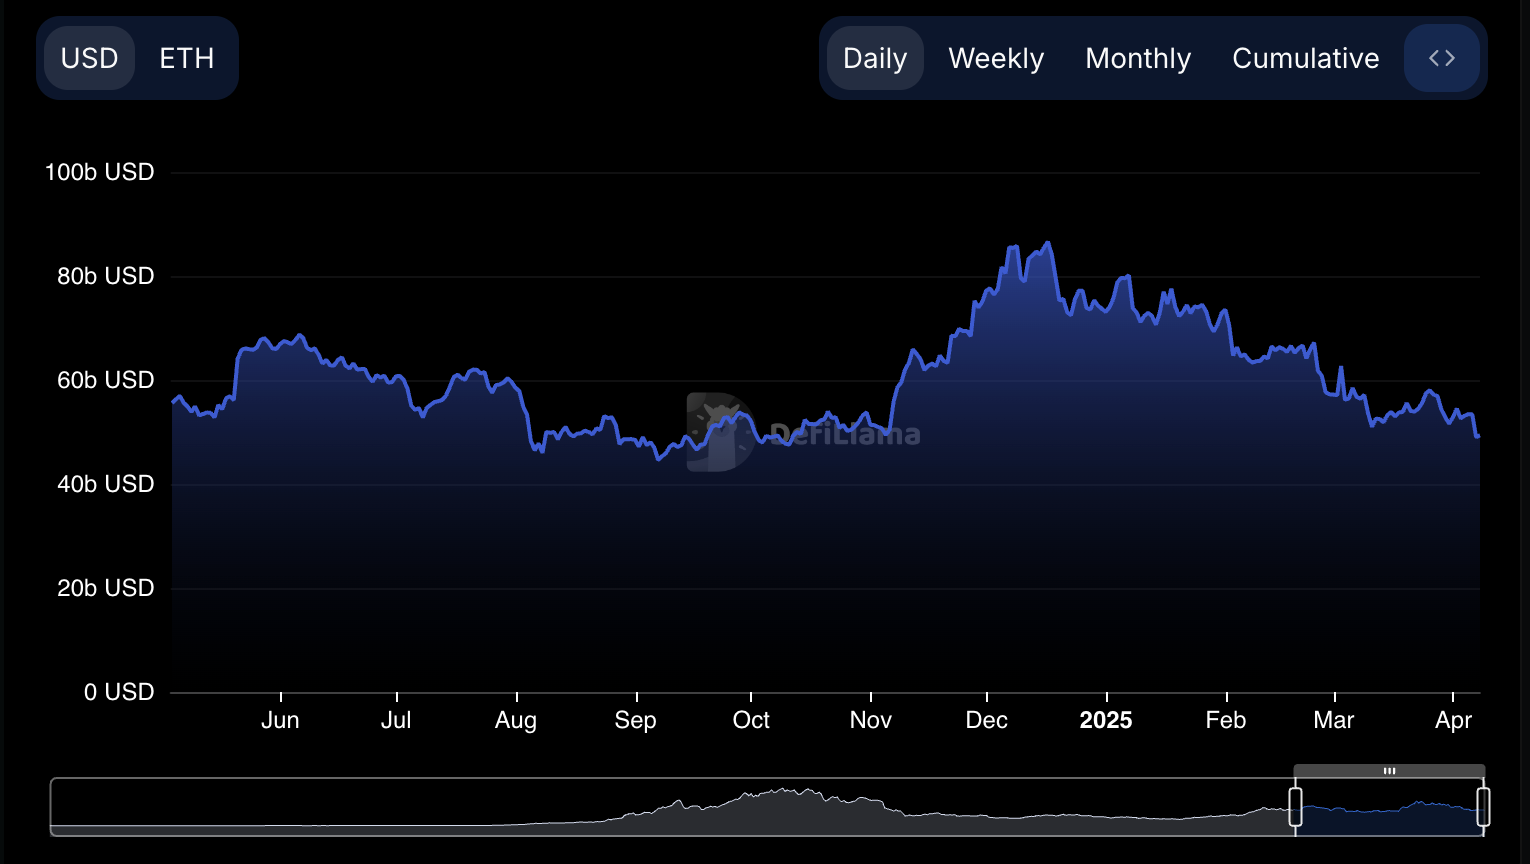 Ethereum TVL. Source: DeFiLlama.
TVL measures the total capital deposited into decentralized finance (DeFi) protocols on a blockchain and serves as a key indicator of ecosystem health and investor confidence.
A rising TVL generally signals growing trust and usage of DeFi applications, while a falling TVL suggests declining demand and reduced engagement.
Ethereum’s TVL is now hovering at multi-month lows, which could be a bearish signal for ETH’s price. This reflects reduced utility and less capital circulating through the network, both of which could put further downward pressure on the asset if the trend continues.
Ethereum Is Currently 70% Down From Its All-Time High
Ethereum’s price has been trading below $2,000 since March 26, and its technical indicators don’t look promising.
The current setup of its Exponential Moving Averages (EMAs) shows a bearish formation, with short-term EMAs positioned below the longer-term ones — a classic signal of ongoing downside momentum.
This suggests that sellers are still in control, and the market could be bracing for further correction.
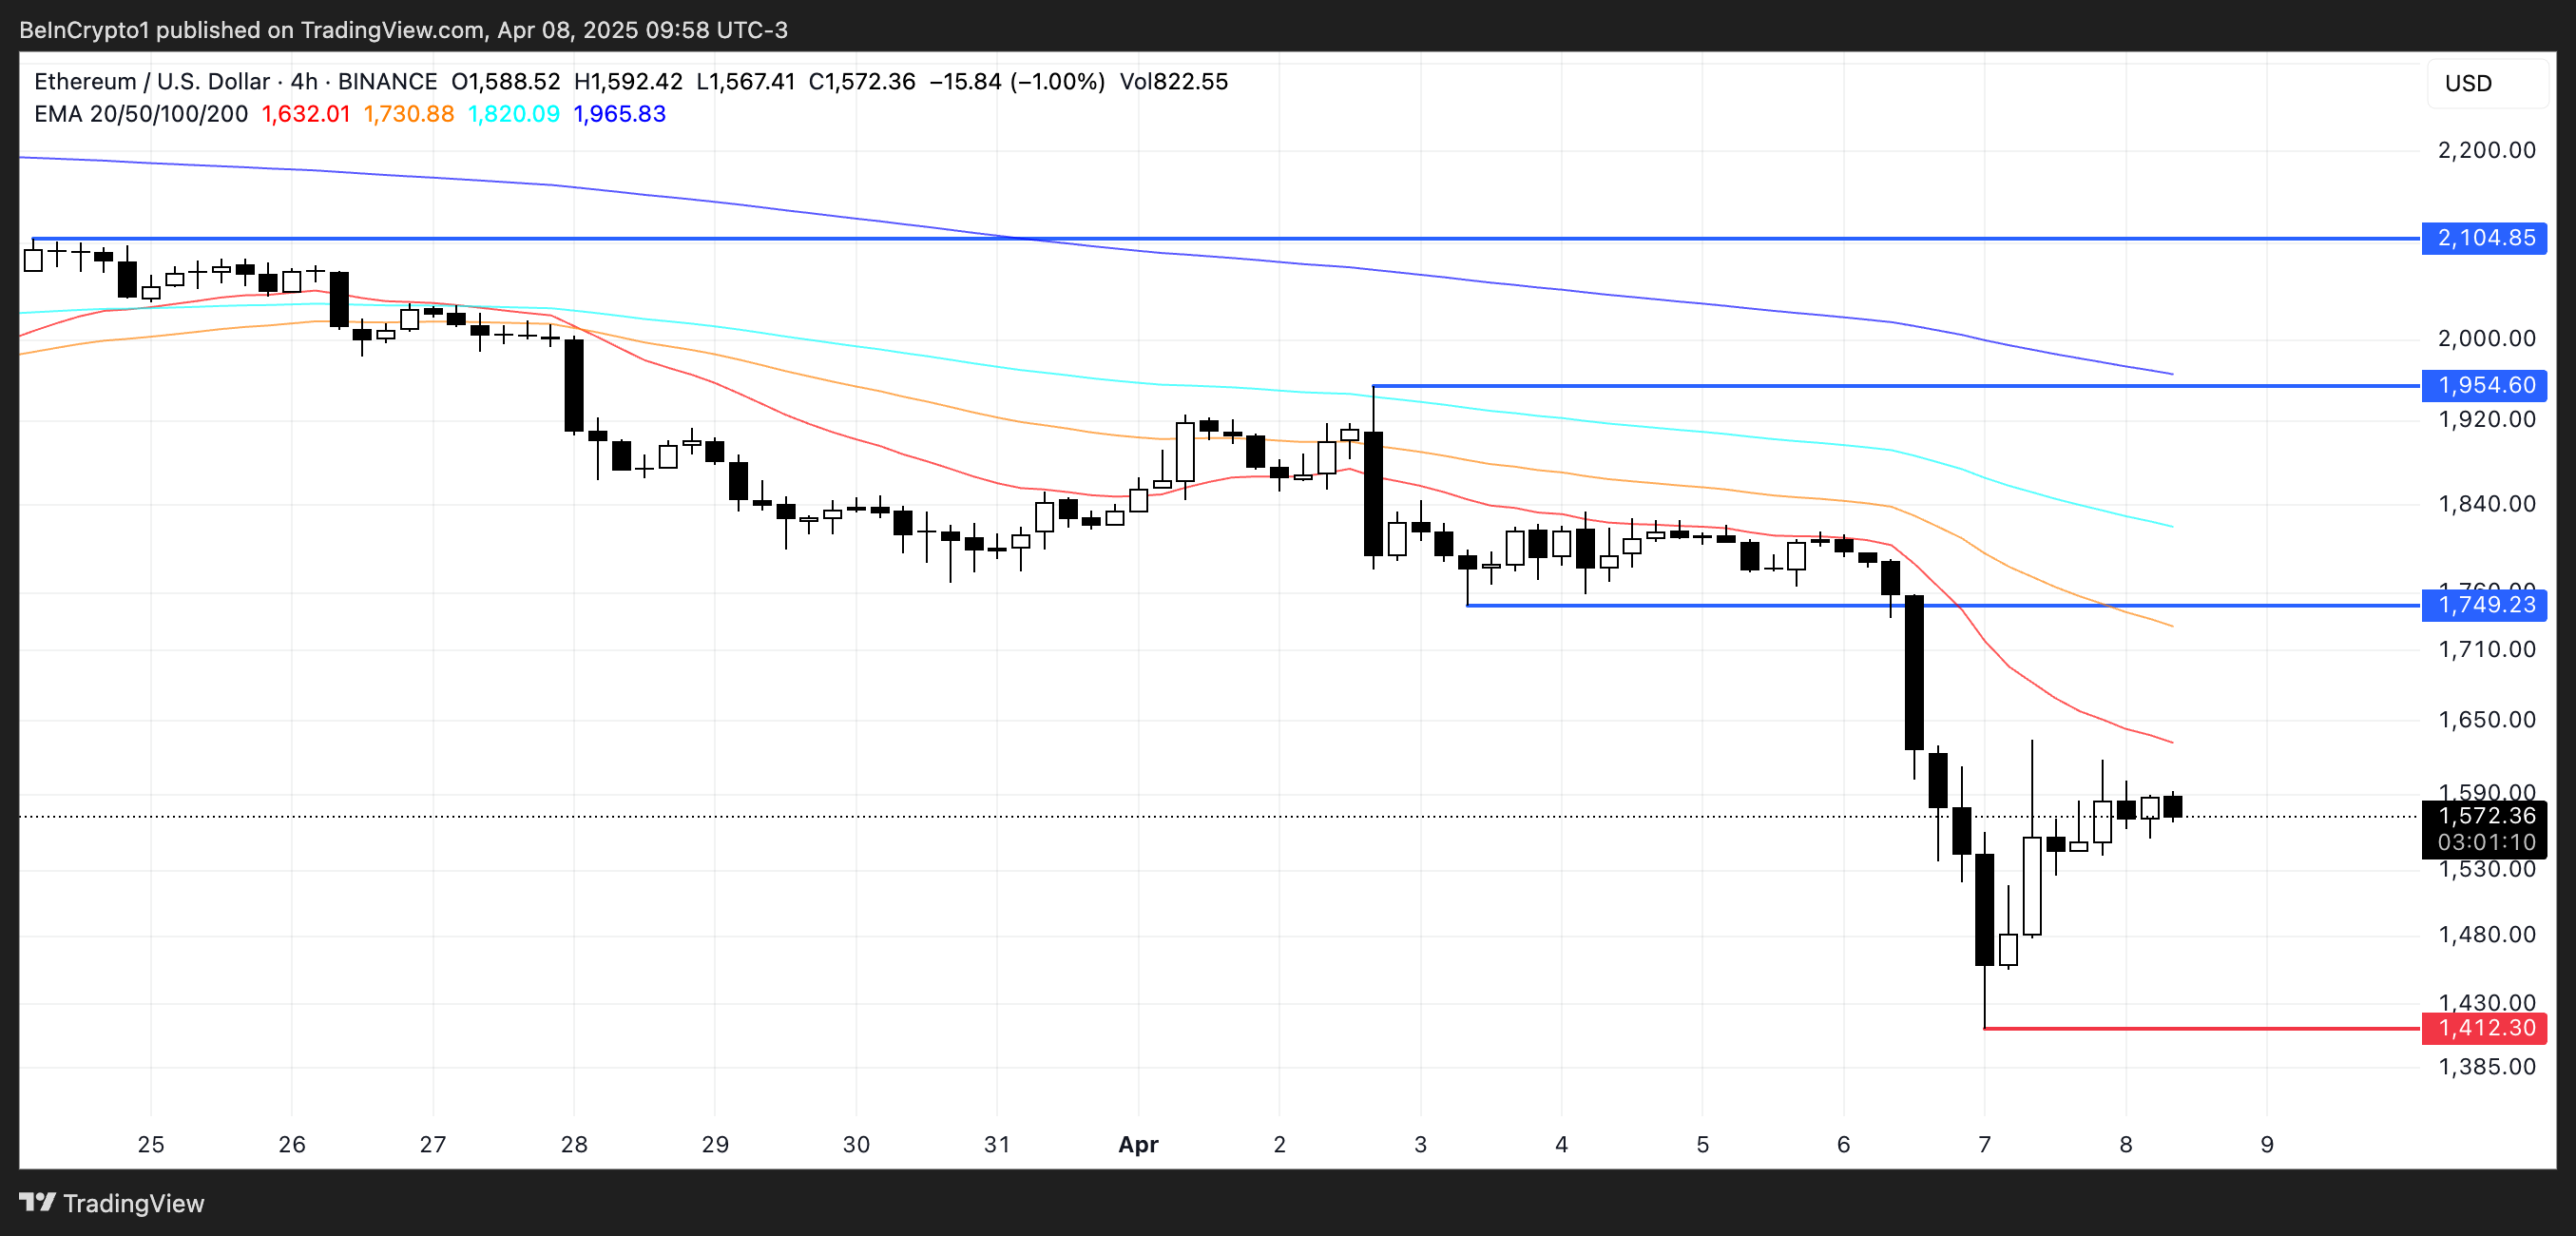 ETH Price Analysis. Source: TradingView.
If bearish momentum continues, Ethereum may retest support near $1,400. A breakdown below that level could trigger a deeper sell-off, with Ethereum price potentially sliding toward $1,000 in April — a key psychological and historical level.
However, if bulls regain control and reverse the trend, ETH could first challenge resistance at $1,749.
A breakout above that would open the door for a test of $1,954, and if momentum stays strong, Ethereum could push past the $2,000 barrier and aim for $2,104.
Recommended Articles


