
Silver Price Forecast: XAG/USD wobbles around $38, awaits clarity on US-EU trade talks

Silver price oscillates in a tight range around $38, with investors awaiting more news regarding trade talks between the US and the EU.
EU trade chief Sefcovic headed to Washington for fresh round of trade talks.
Fed officials warned of accelerating inflationary pressures due to Trump’s tariffs.
Silver price (XAG/USD) trades in a tight range around $38 during the Asian trading session on Wednesday. The white metal consolidates as investors await more cues regarding trade talks between the United States (US) and the European Union (EU).
On Wednesday, US President Donald Trump stated that Washington could possibly has a deal with the EU, while expressing confidence that a trade pact with India is on the horizon.
"We’re very close to India, and we could possibly make a deal with EU, Trump said in an interview aired on Real America’s Voice.
Trump’s comments came at a time when EU trade chief Maros Sefcovic was headed to Washington on Wednesday for next round of trade talks.
Given that the EU is one of leading trading partners of the US, trade tensions between both economies would impact global trade order. Theoretically, the Silver price outperforms in a heightened globally uncertain environment.
Meanwhile, escalating fears that the US inflation will heat up further when additional tariffs imposed by the US on its trading partners will become effective from August 1 are expected to keep supporting the Silver price. Silver tends to perform better in a high-inflation environment.
On Wednesday, New York Federal Reserve (Fed) Bank President John Williams and Atlanta Fed Bank President Raphael Bostic warned that the impact of tariffs on inflation has just started building up and it will accelerate going ahead.
“It's early days for impact of tariffs on economy, which is modest so far but will increase over time,” New York Fed Bank President John Williams said.
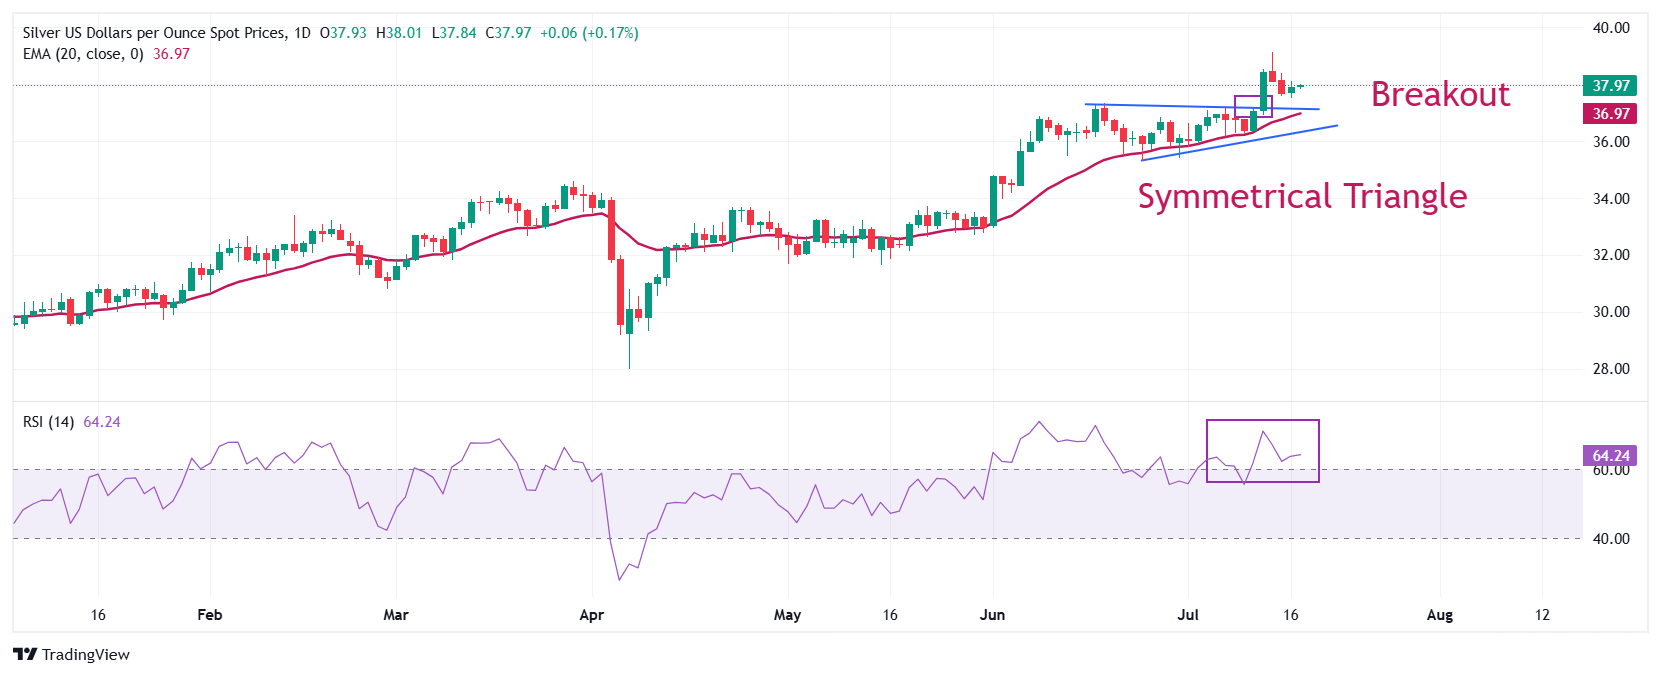
Silver technical analysis
Silver price holds the breakout of the Symmetrical Triangle formation on a daily timeframe, which led it to post a fresh over-a-decade high around $39.13.
Upward-sloping 20-day Exponential Moving Average (EMA) near $37 suggests that the near-term trend is bullish.
The 14-day Relative Strength Index (RSI) oscillates inside the 60.00-80.00 range, indicating a strong bullish momentum.
Looking up, the round-level of $40.00 will be a key barrier for the Silver price. On the downside, the 20-day EMA will act as a key support.
Silver daily chart
* The content presented above, whether from a third party or not, is considered as general advice only. This article should not be construed as containing investment advice, investment recommendations, an offer of or solicitation for any transactions in financial instruments.


