

Cardano price ranges below $0.63, ADA on-chain metrics show signs of sell-off
- Cardano is seeing more loss transactions than profitable ones this week, compared to the Ethereum and Bitcoin network.
- Cardano holders realized 102.38 million in losses in the past week, a likely sign of capitulation.
- At the same time nearly 78% of Cardano wallets are currently sitting on unrealized gains.
Cardano holders who have closed trades this week have realized more losses than profits when compared to the Ethereum and Bitcoin networks, according to on-chain data from Santiment. That ADA holders are shedding their holdings at a loss, could be a sign the altcoin is selling off. The fact it is coinciding with large wallet holders accumulating, however, could be a sign of hope for bulls, that traders are “buying the dip."
At the current price of $0.618, nearly 78% of ADA holders are still profitable, suggesting the capitulation phase may be close to ending and that there is hidden strength for the altcoin. If ADA price rallies past the $0.63 level, there is no significant resistance on Cardano’s path to $0.75.
Also read: Cardano price notes further decline, report reveals 74% of ADA ecosystem coins are dead
Cardano on-chain metrics show holders are realizing losses
Cardano whale transactions show spikes that coincide with realized losses in the Network Realized Profit/ Loss metric. At the same time as some holders are cutting their losses, whale transactions valued at $100,000 and higher have surged. Historically, this has happened on two previous occasions in the past six months:
- Immediately after a Cardano price drop.
- Coinciding with negative spikes (losses) in Network Realized Profits/ Loss metric.
This shows that whales are likely accumulating ADA during a dip phase, with the possibility of a price renaissance afterwards.
%20[13.15.00,%2028%20Feb,%202024]-638447092693637554.png)
Cardano Network Realized Profit/Loss and Whale Transactions Valued at $100,000. Source: Santiment
The capitulation phase typically comes to an end when large wallet investors have no more assets to sell, and is followed by an increase in buying pressure from traders buying the pull back in the asset’s price.
It is likely that Cardano is currently in the capitulation phase, following this, sidelined buyers will have an opportunity to step in and buy ADA price at a discount.
Analysts at on-chain intelligence tracker Santiment identified that this week, Cardano is seeing more holders realize losses than profits, when compared to the ratio of profitable on-chain transfers on the Ethereum network and Bitcoin.
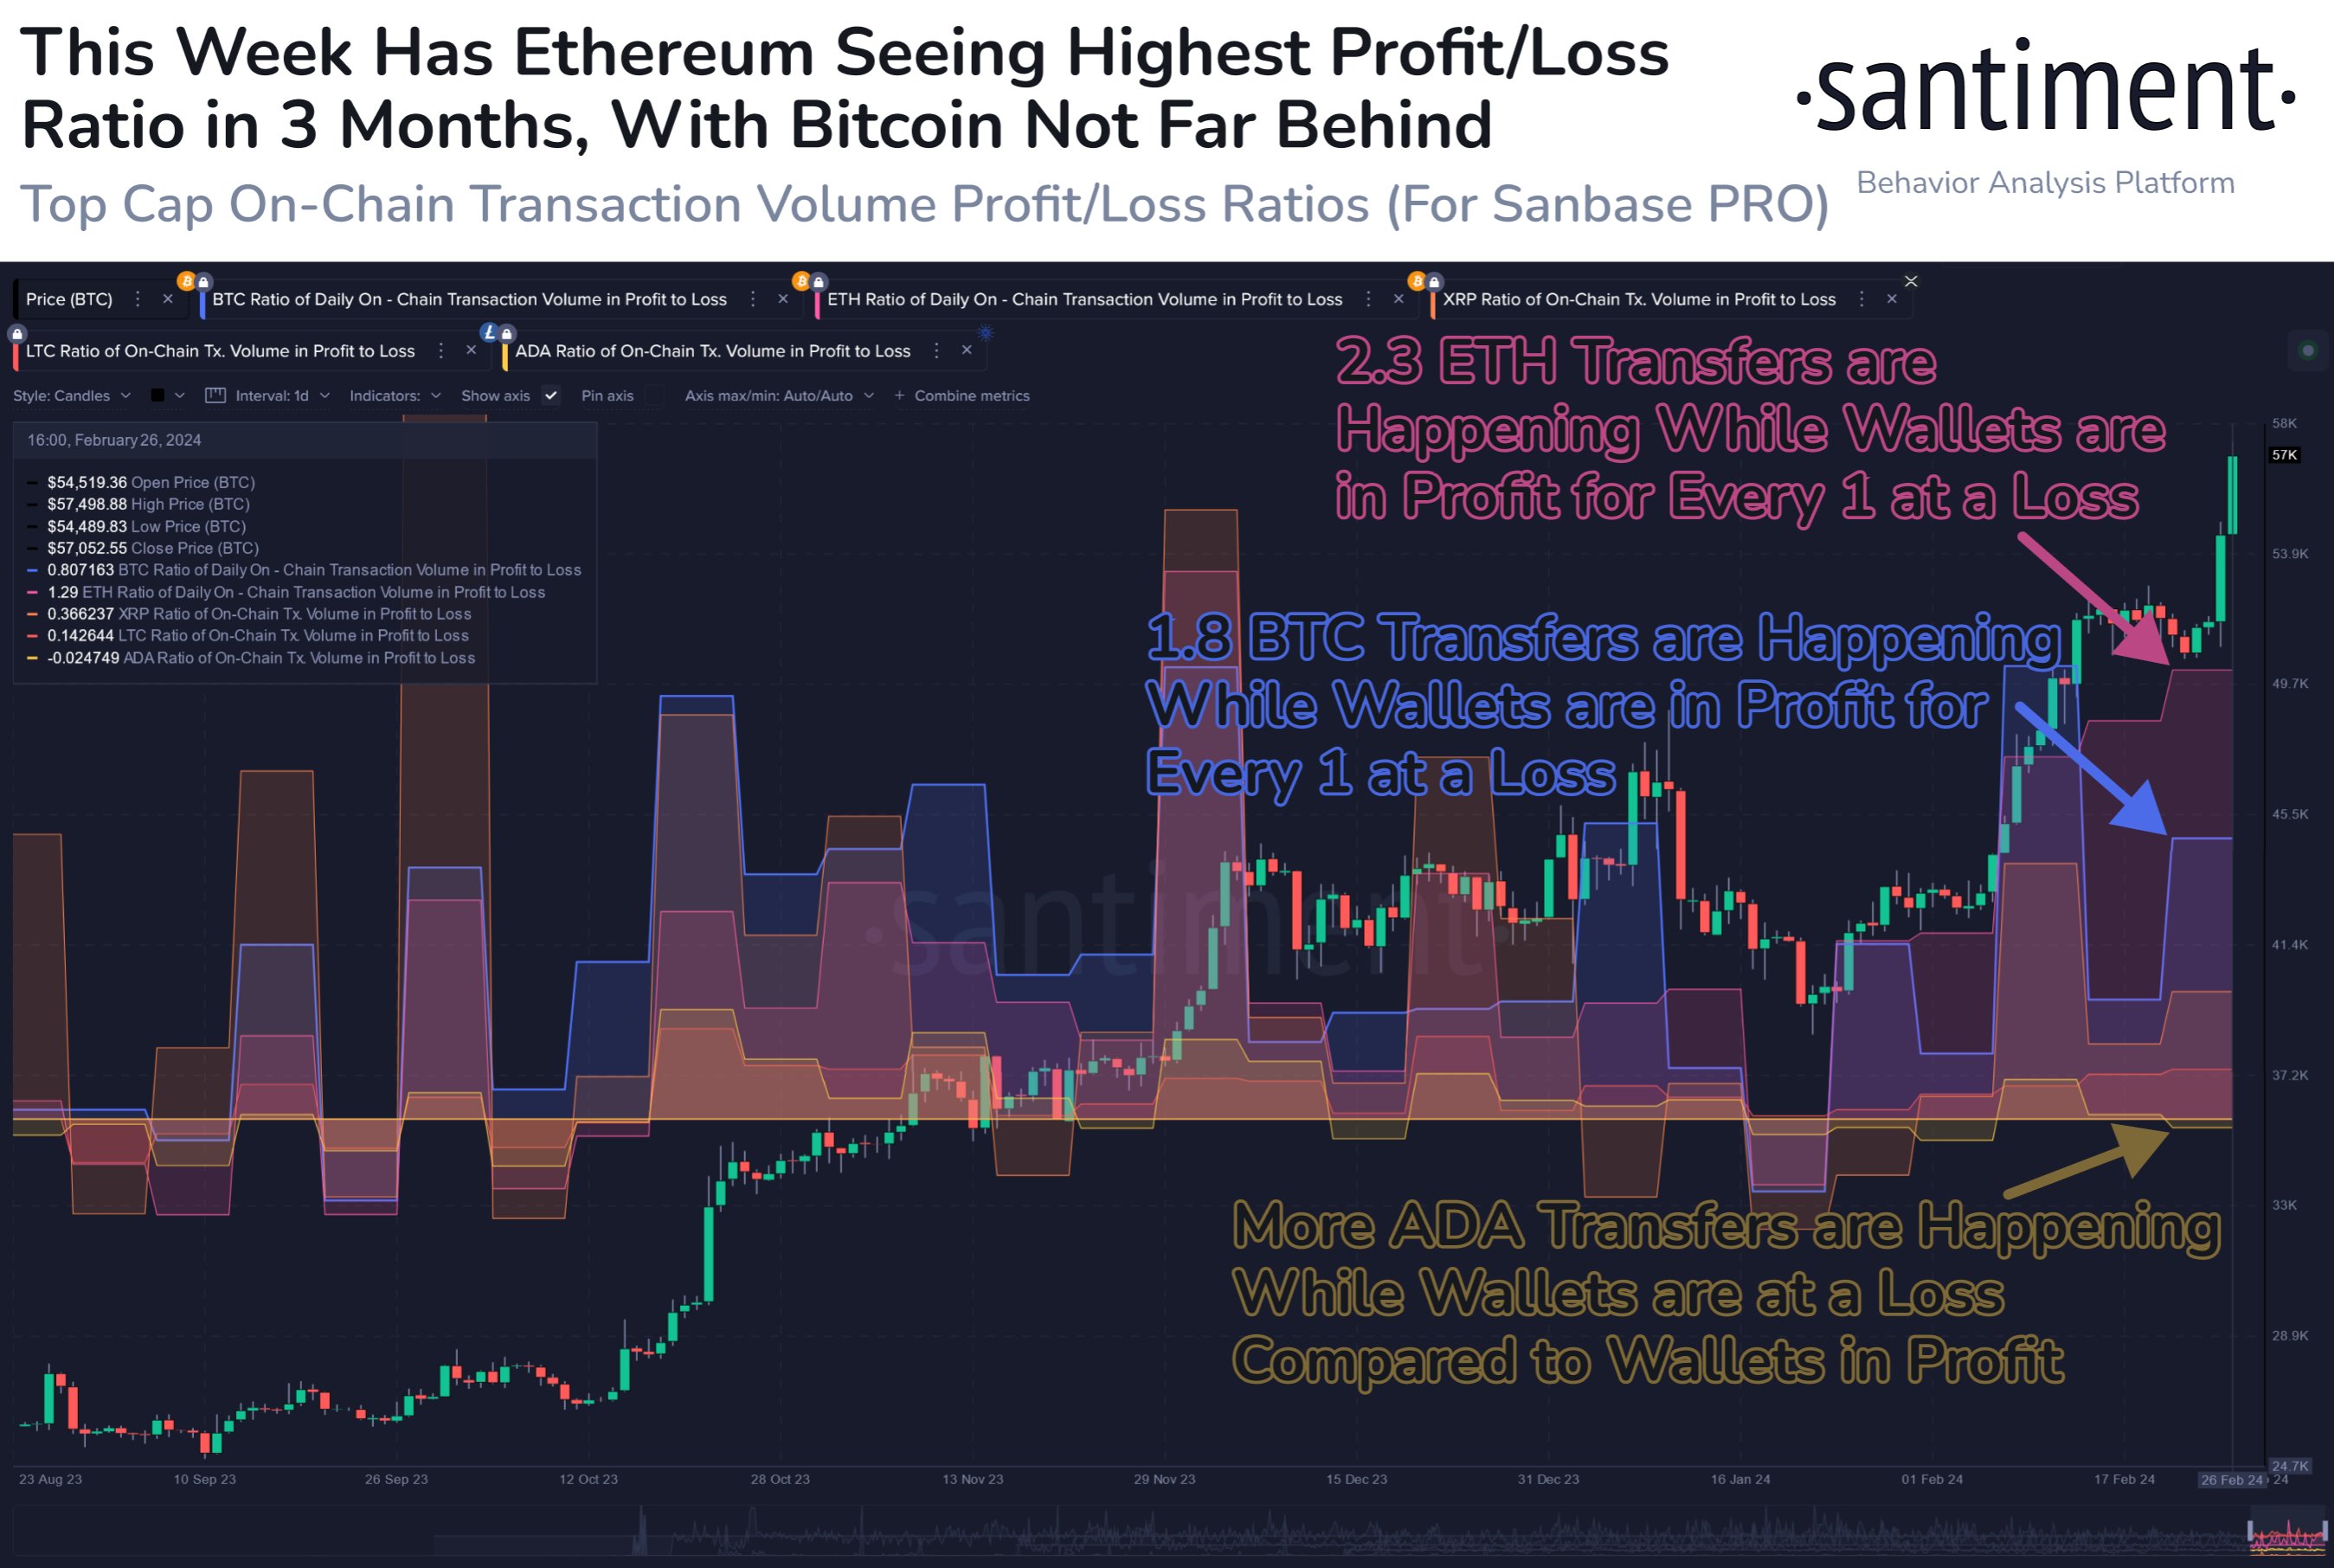
Cardano transfers happening at a loss. Source: Santiment
This metric supports the thesis that Cardano price is likely to see a recovery following the ongoing correction and capitulation.
At the current price level, 77.84% of wallets holding Cardano are sitting on unrealized profits. A mere 15% addresses are sitting on unrealized losses. Interestingly, IntoTheBlock data shows that the only significant resistance in Cardano’s path to $0.75 is the $0.63 level.
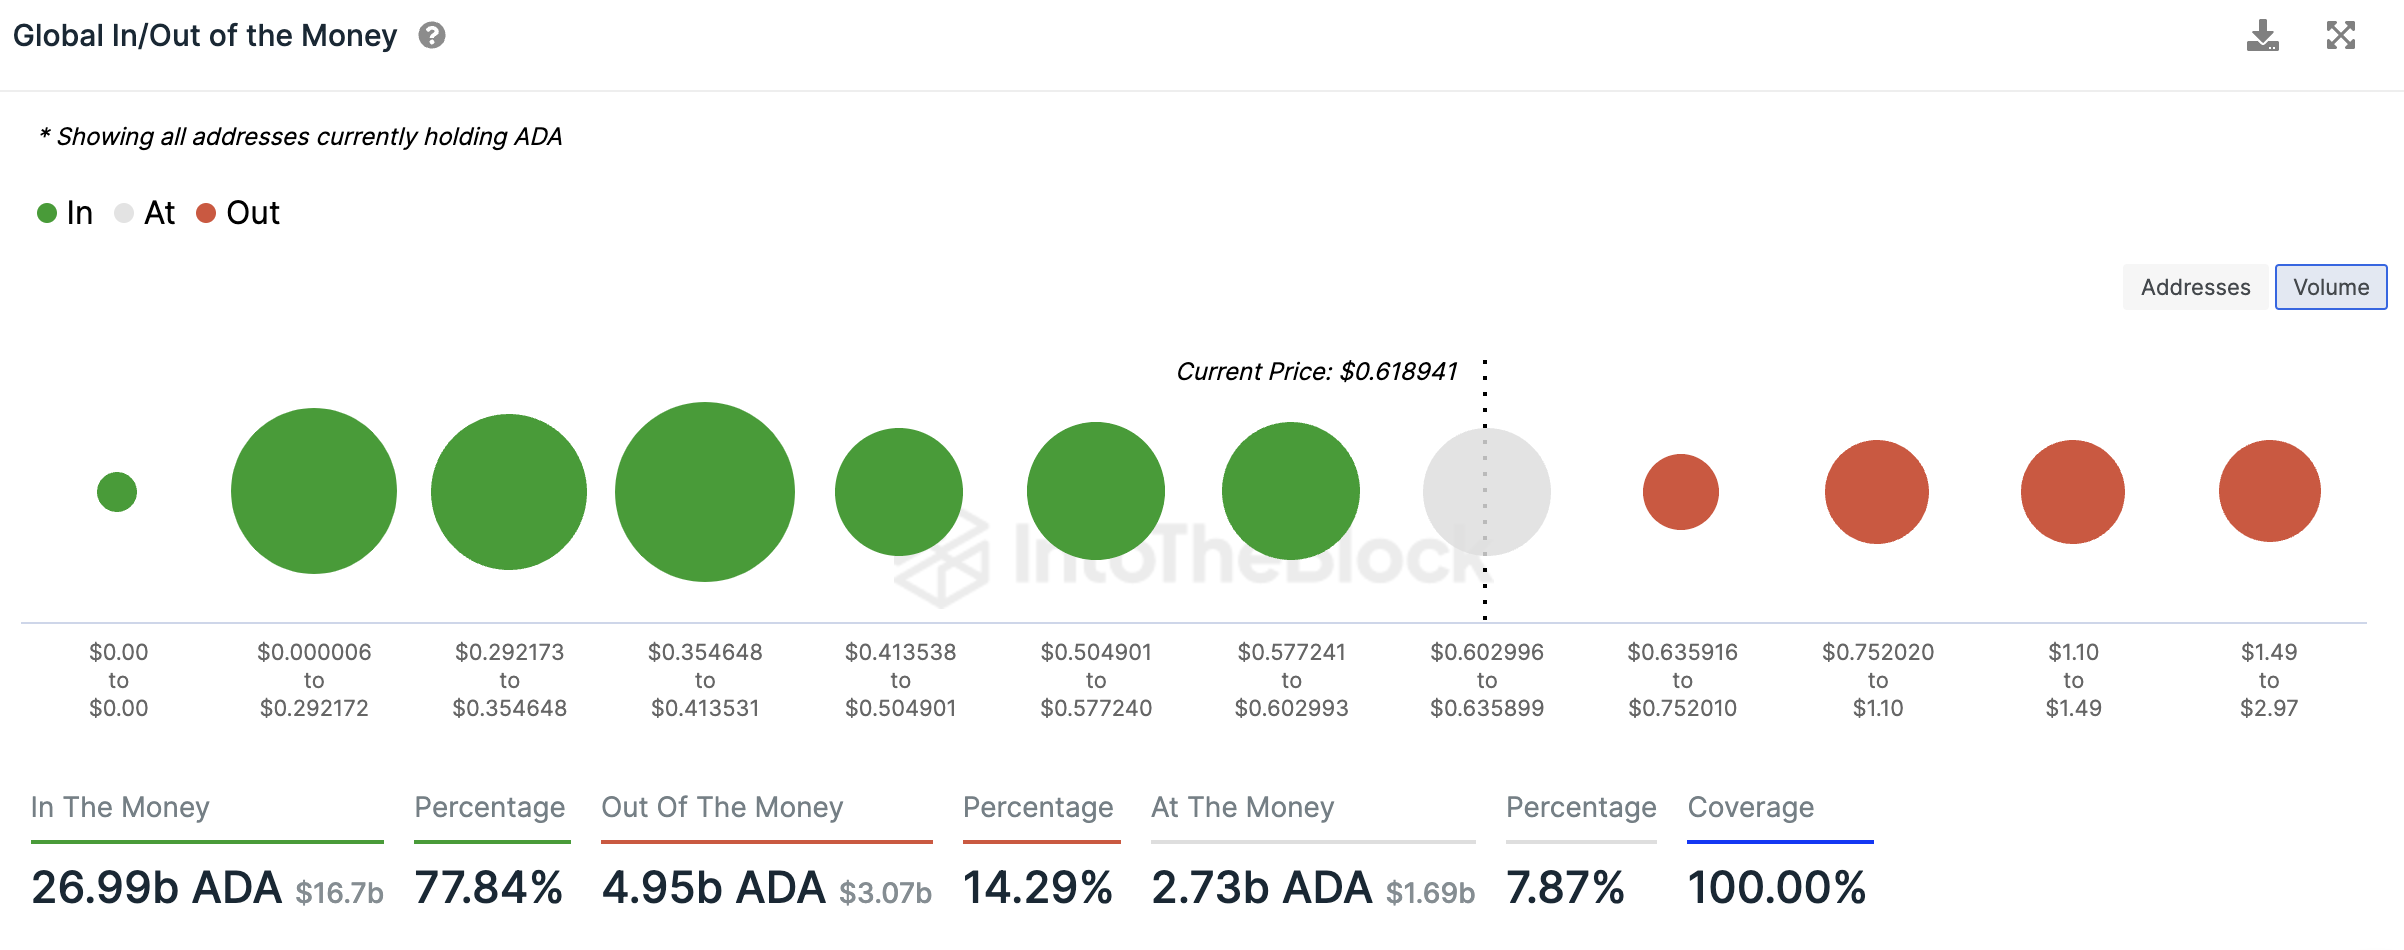
Global In/Out of the Money. Source: IntoTheBlock
Cardano price could rally towards $0.75 target
Cardano price is currently in an uptrend. The altcoin is likely to rally towards the $0.7520 target where 536.39 million ADA tokens were accumulated by 51,270 wallet addresses. The $0.6359 level is likely to act as resistance in Cardano’s price rally to its target.
The Moving Average Convergence Divergence (MACD) indicator and the Awesome Oscillator (AO) support Cardano’s uptrend and show there is positive momentum in ADA.
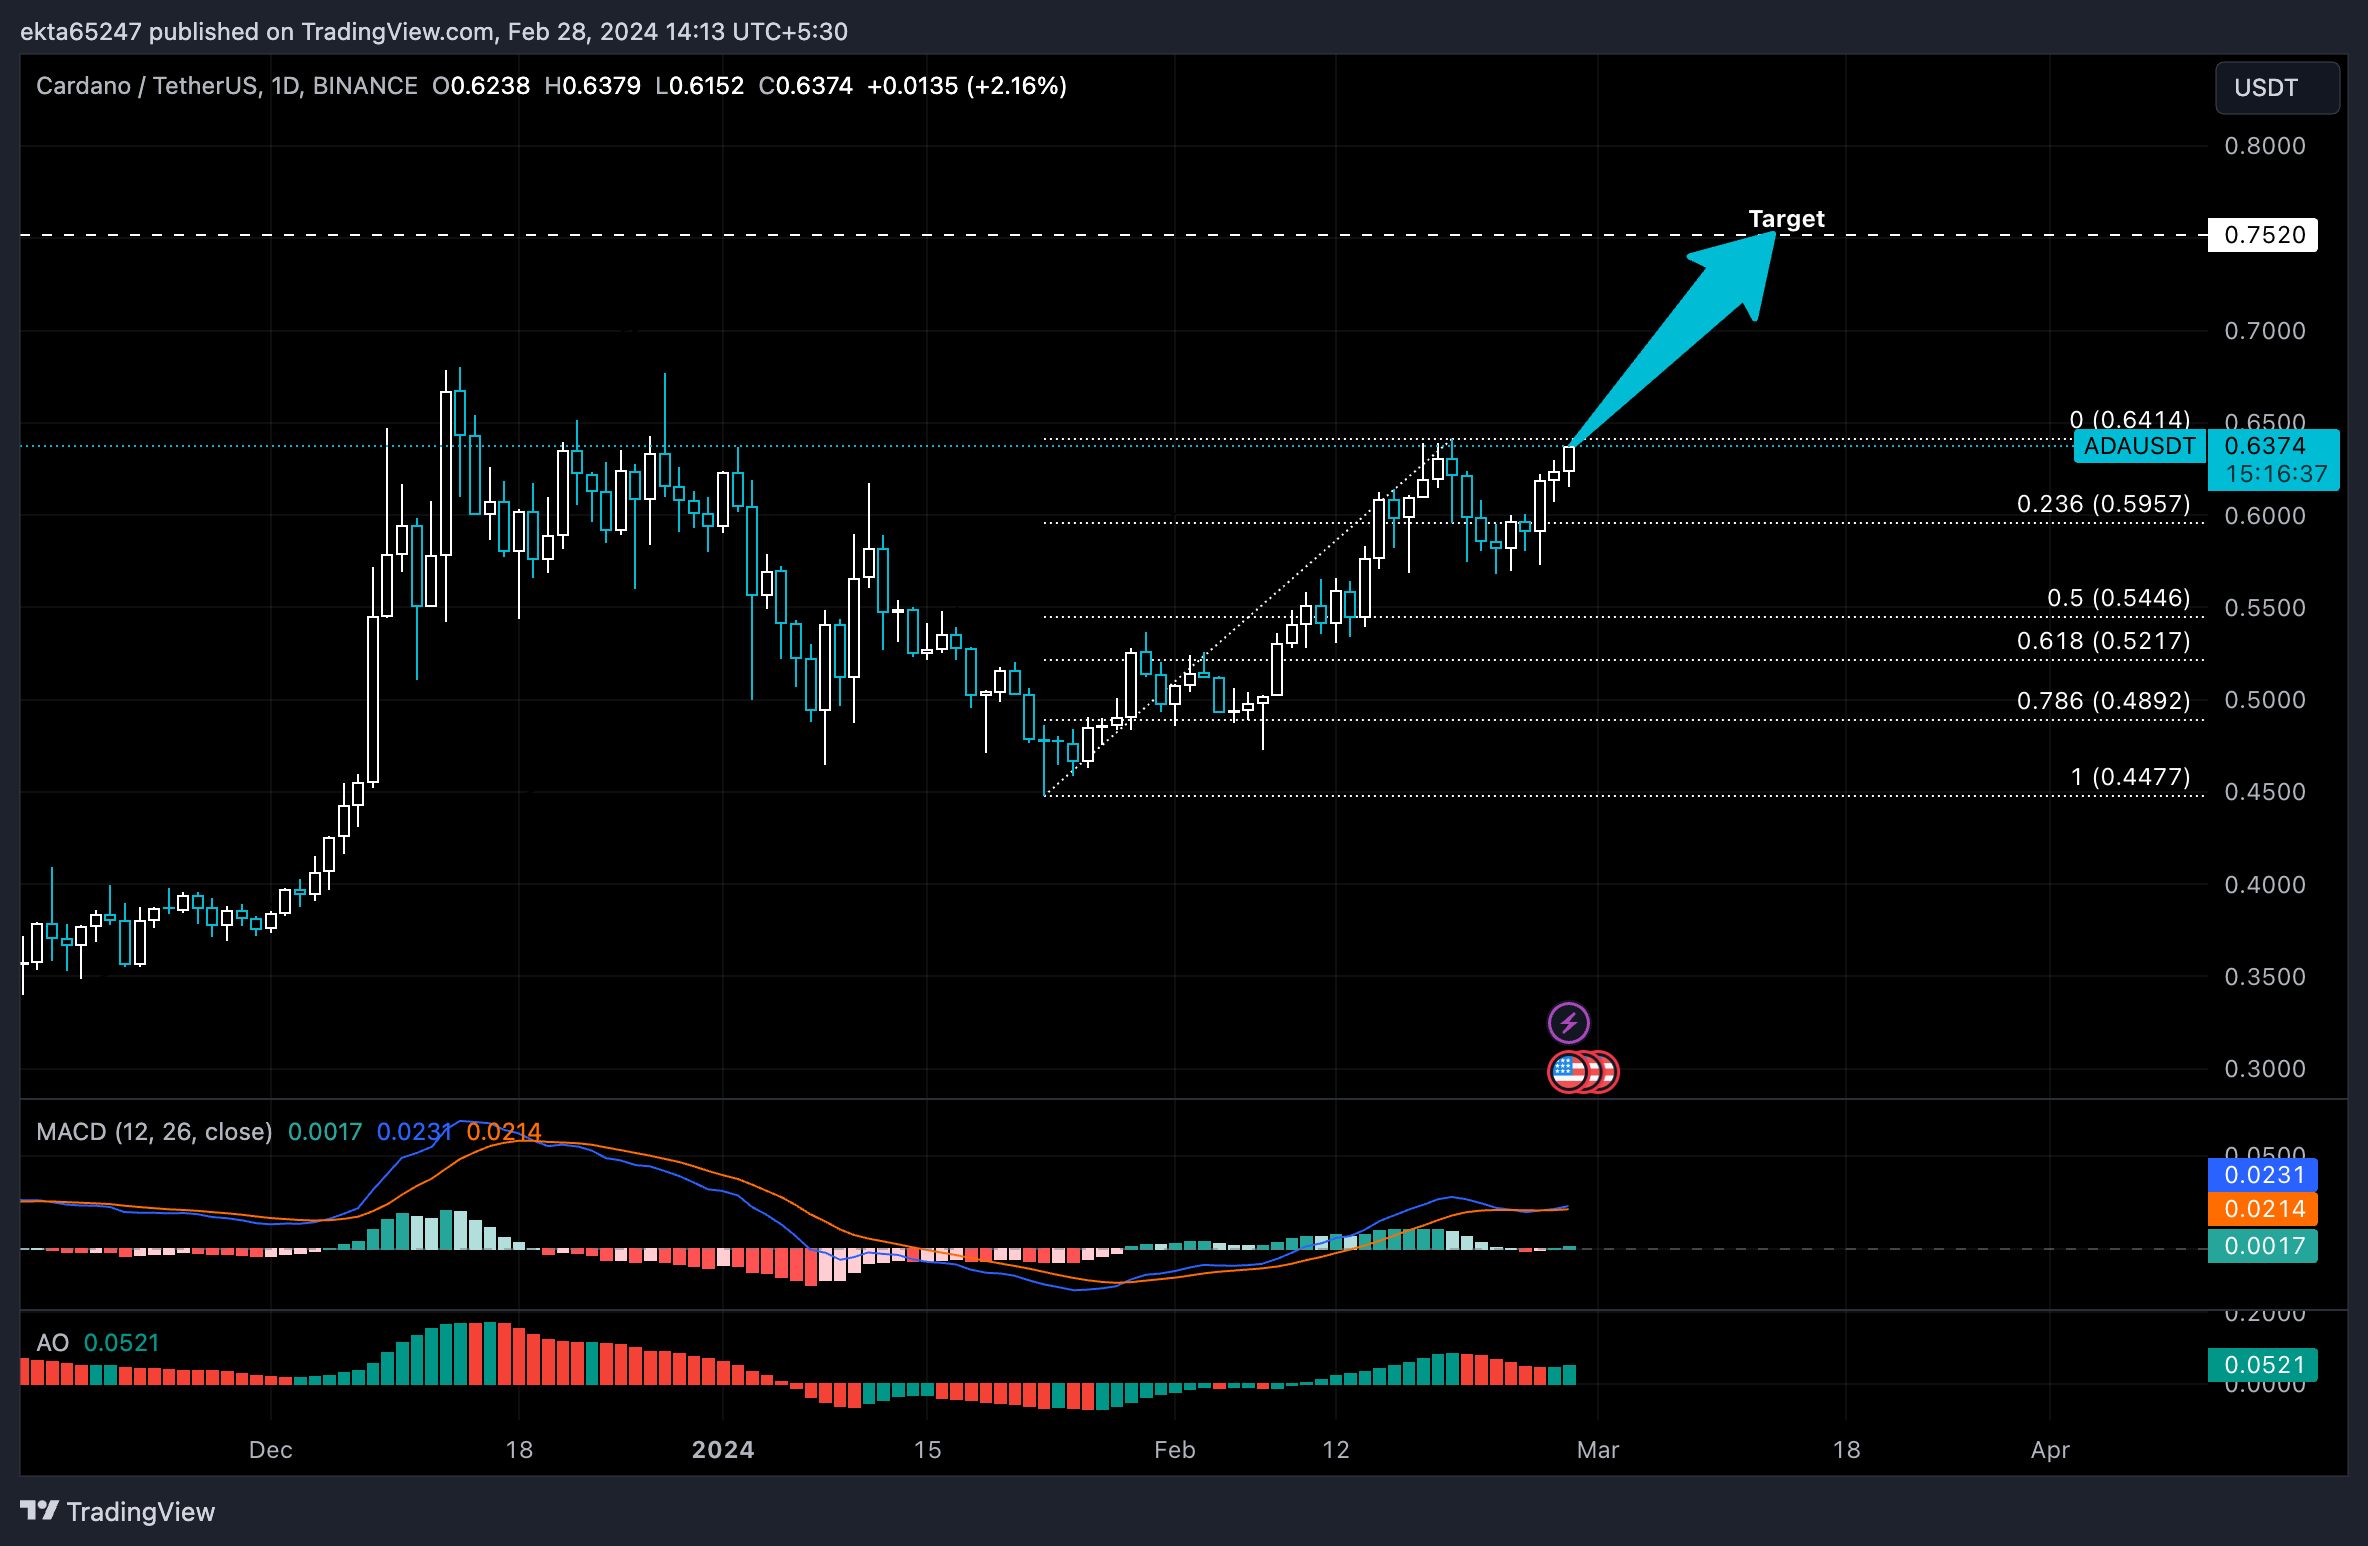
ADA/USDT 1-day chart
A daily candlestick close below the 23.6% Fibonacci retracement level of the climb to Cardano’s 2024 peak, at $0.5957, could invalidate the bullish thesis and Cardano price could sweep the 50% Fibonacci retracement level at $0.5446 before attempting a recovery in its price.
Recommended Articles


