

Bitcoin Price Correlation with M2 Money Supply Signals a Bullish Q2 

Source Beincrypto

The global M2 money supply has surged to an all-time high of $108.4 trillion, raising fresh questions about Bitcoin’s next move. 

The milestone comes amid escalating economic uncertainty following former President Donald Trump’s new “Liberation Day” tariffs and China’s swift retaliatory measures, which together have roiled global markets.

What is M2 and Why Does It Matter for Bitcoin?

Despite the extreme volatility over the past two weeks, Bitcoin’s average value has remained almost unchanged. 

Analysts claim that Bitcoin’s latest volatility reflects macroeconomic fears and fluctuating long/short ratios – but the largest cryptocurrency is nowhere near a bear market. 

This is largely due to the historical correlation between rising M2 levels and significant Bitcoin rallies.

M2 is a broad measure of a country or region’s money supply. It includes physical cash, checking and savings deposits, and other liquid assets that can be quickly converted to cash. 
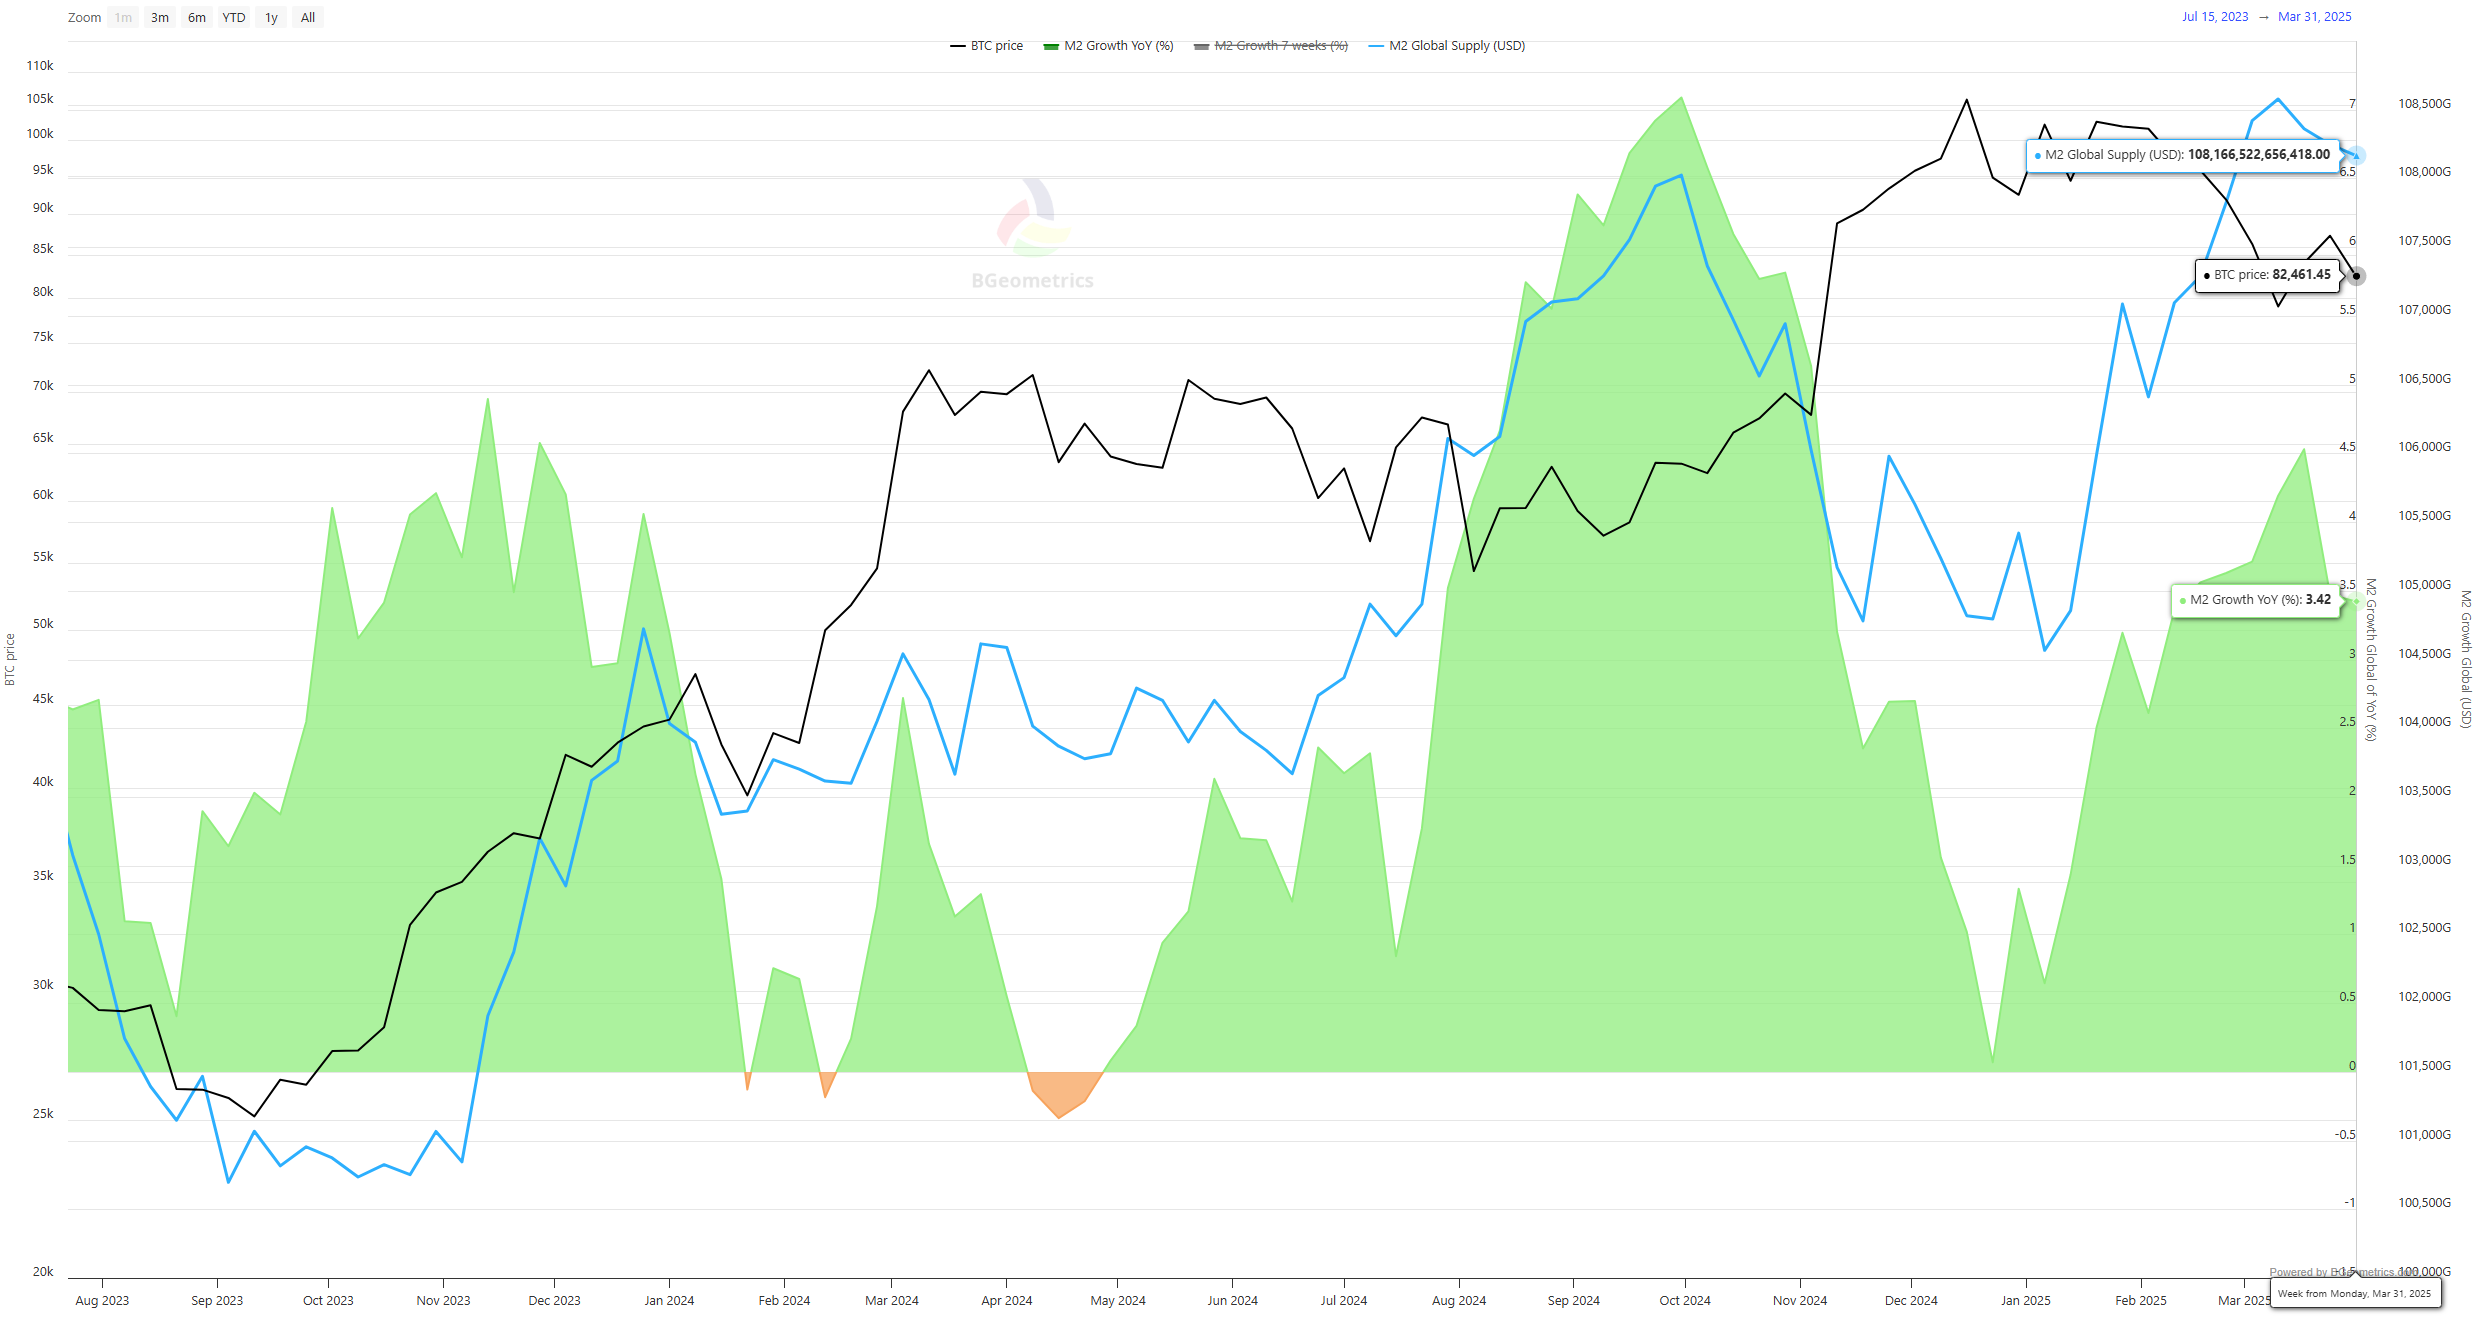
Bitcoin and M2 Money Supply Chart Bitcoin and M2 Money Supply Chart In the Past Year. Source: BGeometrics

When M2 increases, it typically signals greater liquidity in the financial system. It simply means more money that often seeks returns in riskier assets such as equities, real estate, or cryptocurrencies like Bitcoin.

Past surges in the M2 money supply have preceded major Bitcoin rallies. Following the COVID-era stimulus programs in 2020-2021, the US M2 supply jumped by over 25%. 

This correlated with Bitcoin’s rise from under $10,000 in mid-2020 to an all-time high of over $69,000 by November 2021. Analysts point to a similar pattern today, albeit with a lag.

“Market proponents say that Trump’s tariffs are primarily a negotiation strategy, and their effect on businesses and consumers will remain manageable. Adding to the uncertainty are the inflationary pressures that could challenge the US Federal Reserve’s rate-cutting outlook. Also, resolving the debt ceiling remains a pressing issue, as the Treasury currently relies upon ‘extraordinary measures’ to meet US financial obligations. The exact timeline for when these measures will be exhausted is unclear, but analysts anticipate they may run out after the first quarter,” said Maksym Sakharov, Co-Founder of WeFi Deobank.

Also, Bitcoin’s price often trails global M2 growth by roughly two months. 

With M2 accelerating since late February and the current spike taking it to its highest level ever, market watchers suggest that Bitcoin could see a delayed but strong upside if liquidity continues to expand.

However, macroeconomic headwinds could temper near-term gains. Trump’s tariff shock and China’s tit-for-tat response have already triggered the steepest Wall Street losses in five years. 

Investors may delay allocating capital to high-volatility assets until trade tensions stabilize.

Still, with M2 surging and Bitcoin supply capped, the setup for a renewed bullish move remains in place. That is if historical patterns hold and markets regain confidence.

Disclaimer: For information purposes only. Past performance is not indicative of future results.
placeholder
Dollar presses 102 as the 10-year yield sits at 5.14% — and October hike odds are only 17%The dollar index closed at 101.99 (+0.20%) on Monday after briefly topping 102.07, while the 10-year Treasury yield rose to 5.14% and the 2-year hit 4.774% — yet futures price only about a 17% chance of a hike at the October 27-28 FOMC, versus roughly 90% for December. The driver is a global bond selloff, not a Fed repricing: France's 10-year OAT jumped to 4.84% ~ 4.94% and the OAT-Bund spread widened to 140 ~ 146bp. Here are the levels, the cross-asset read-through and what to watch.
Author  Irene Q.
Oct 20, Tue
The dollar index closed at 101.99 (+0.20%) on Monday after briefly topping 102.07, while the 10-year Treasury yield rose to 5.14% and the 2-year hit 4.774% — yet futures price only about a 17% chance of a hike at the October 27-28 FOMC, versus roughly 90% for December. The driver is a global bond selloff, not a Fed repricing: France's 10-year OAT jumped to 4.84% ~ 4.94% and the OAT-Bund spread widened to 140 ~ 146bp. Here are the levels, the cross-asset read-through and what to watch.
placeholder
Meta's AI bill just hit $145 billion — and it issued a new share class to pay for itMeta reported record third-quarter revenue of $64.60 billion, up 26% from a year earlier, and raised full-year 2026 capital expenditure guidance to $135-145 billion from $130-145 billion. To fund that build-out without touching Mark Zuckerberg's voting control, the company announced a 2-for-1 stock split that hands every Class A holder a new non-voting Class C share. Here are the four lines that matter, the peer group that is being re-rated alongside it, and the bull and bear cases.
Author  Irene Q.
Oct 22, Thu
Meta reported record third-quarter revenue of $64.60 billion, up 26% from a year earlier, and raised full-year 2026 capital expenditure guidance to $135-145 billion from $130-145 billion. To fund that build-out without touching Mark Zuckerberg's voting control, the company announced a 2-for-1 stock split that hands every Class A holder a new non-voting Class C share. Here are the four lines that matter, the peer group that is being re-rated alongside it, and the bull and bear cases.
placeholder
The Fed will sit still on October 28 — but 100 of 100 economists now expect a December hikeA Reuters poll run October 16-20 found 94 of 100 economists expecting the Fed to hold at 3.75-4.00% on October 28 — and all 100 expecting a hike in December, against less than half a month earlier. The market is close to the same price, with CME FedWatch at roughly 17% for October and 82.8% for December. With the Fed in blackout since October 17, here are the five dates that decide the rest of the year, what each one is priced for, and the two directions each can take.
Author  Irene Q.
Oct 22, Thu
A Reuters poll run October 16-20 found 94 of 100 economists expecting the Fed to hold at 3.75-4.00% on October 28 — and all 100 expecting a hike in December, against less than half a month earlier. The market is close to the same price, with CME FedWatch at roughly 17% for October and 82.8% for December. With the Fed in blackout since October 17, here are the five dates that decide the rest of the year, what each one is priced for, and the two directions each can take.
placeholder
Gold Price Analysis Today | Forex Gold Analysis | XAU/USD Analysis - October 23, 2026Get the latest gold price analysis, forex gold insights, and XAU/USD analysis for October 23, 2026. Read on for the details.
Author  Mitrade
Yesterday 02: 56
Get the latest gold price analysis, forex gold insights, and XAU/USD analysis for October 23, 2026. Read on for the details.
placeholder
Nasdaq closes at 26,008.86 — 8.9 points above 26,000, and the credit market never blinkedThe Nasdaq Composite fell 2.60% to 26,008.86 on October 22, its worst session since June, as Meta sank 6.98% on 2026 capex guidance of $135–145 billion. But the equal-weight S&P 500 rose 0.73%, high-yield credit was flat and 10-year yields fell 20 basis points. This was an AI de-rating, not a risk-off event — here is the transmission chain, the 29,000 / 28,200 levels and what would prove it wrong.
Author  Irene Q.
Yesterday 06: 39
The Nasdaq Composite fell 2.60% to 26,008.86 on October 22, its worst session since June, as Meta sank 6.98% on 2026 capex guidance of $135–145 billion. But the equal-weight S&P 500 rose 0.73%, high-yield credit was flat and 10-year yields fell 20 basis points. This was an AI de-rating, not a risk-off event — here is the transmission chain, the 29,000 / 28,200 levels and what would prove it wrong.
goTop
quote