Onyxcoin’s (XCN) 70% Drop Could Mark the Bottom as Bullish Sentiment Resurfaces

Source Beincrypto

Onyxcoin has struggled since reaching a year-to-date high of $0.04 on January 26. It has since shed over 70% of its value to trade at $0.011 at press time.

However, the renewed optimism in the broader crypto market is shifting sentiment toward XCN, setting it up for a recovery.

XCN Traders Bet Big on a Comeback

On-chain data suggests that demand for long positions is increasing, hinting at a resurgence in traders’ confidence. At press time, XCN’s long/short ratio is at 1.35, its highest in over 30 days. 

XCN Long/Short Ratio
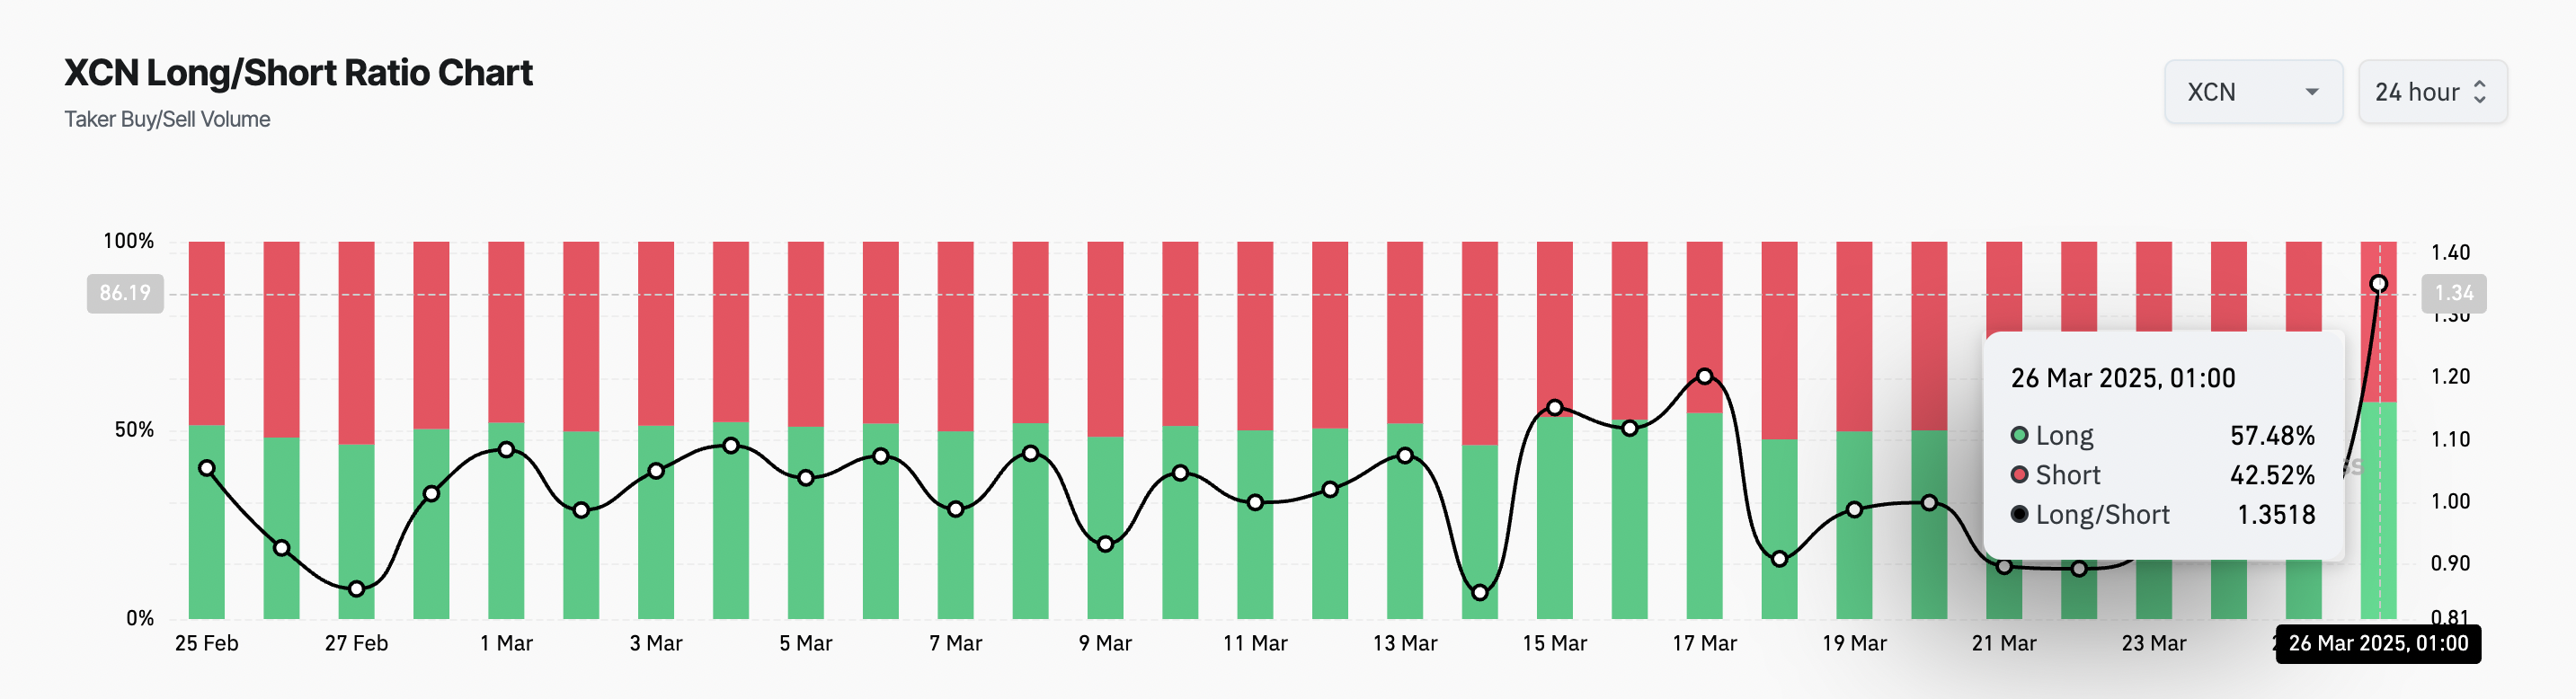
XCN Long/Short Ratio. Source: Coinglass

The long/short ratio measures the proportion of long positions (bets on price increases) to short positions (bets on price declines) in the market. A ratio below one means there are more short positions than long ones. Conversely, a ratio above one suggests that traders are taking more long positions, signaling a bullish outlook on the asset. 

When the ratio is this high, traders expect the price to rise, increasing the buy orders in the market. If this continues, it will drive up XCN’s demand and, as a result, its price. 

Additionally, the token’s weighted sentiment is positive, further reinforcing the notion that investors’ confidence in XCN’s short-term recovery is increasing. At press time, this on-chain metric stands at 0.82. 

XCN Weighted Sentiment.
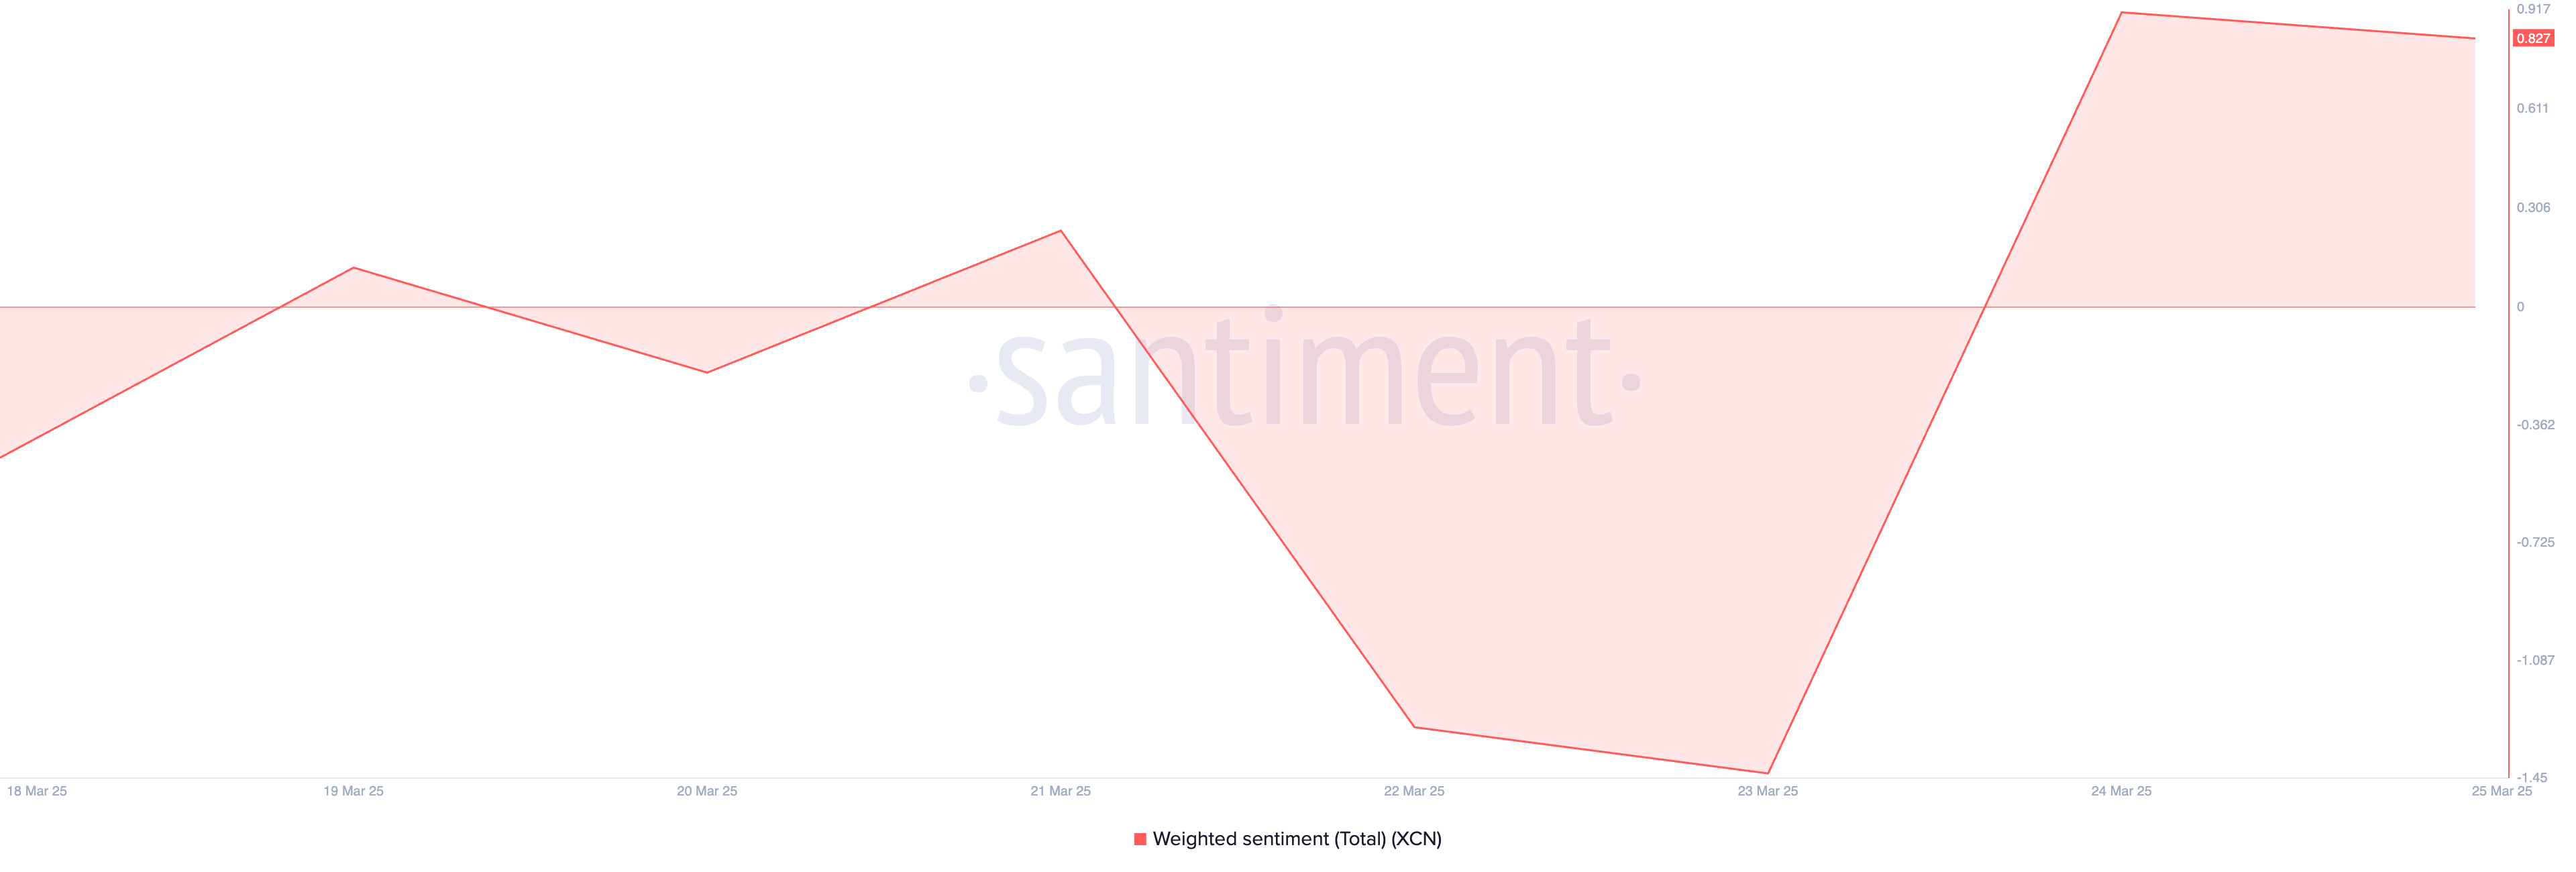
XCN Weighted Sentiment. Source: Santiment

An asset’s weighted sentiment measures its overall positive or negative bias, considering both the volume of social media mentions and the sentiment expressed in those mentions. 

When it is positive, it is a bullish signal. It indicates a growth in positive bias toward XCN, which could prompt its investors to increase their trading activity, driving up its value. 

XCN Bulls Eye a Break Above Descending Channel

On the daily chart, XCN is poised to break above the upper trend line of the descending channel which has kept its price in a decline since January 26. 

If successful, the bullish breakout could propel the token’s price to $0.022, a high it last reached on February 18.

XCN Price Analysis.
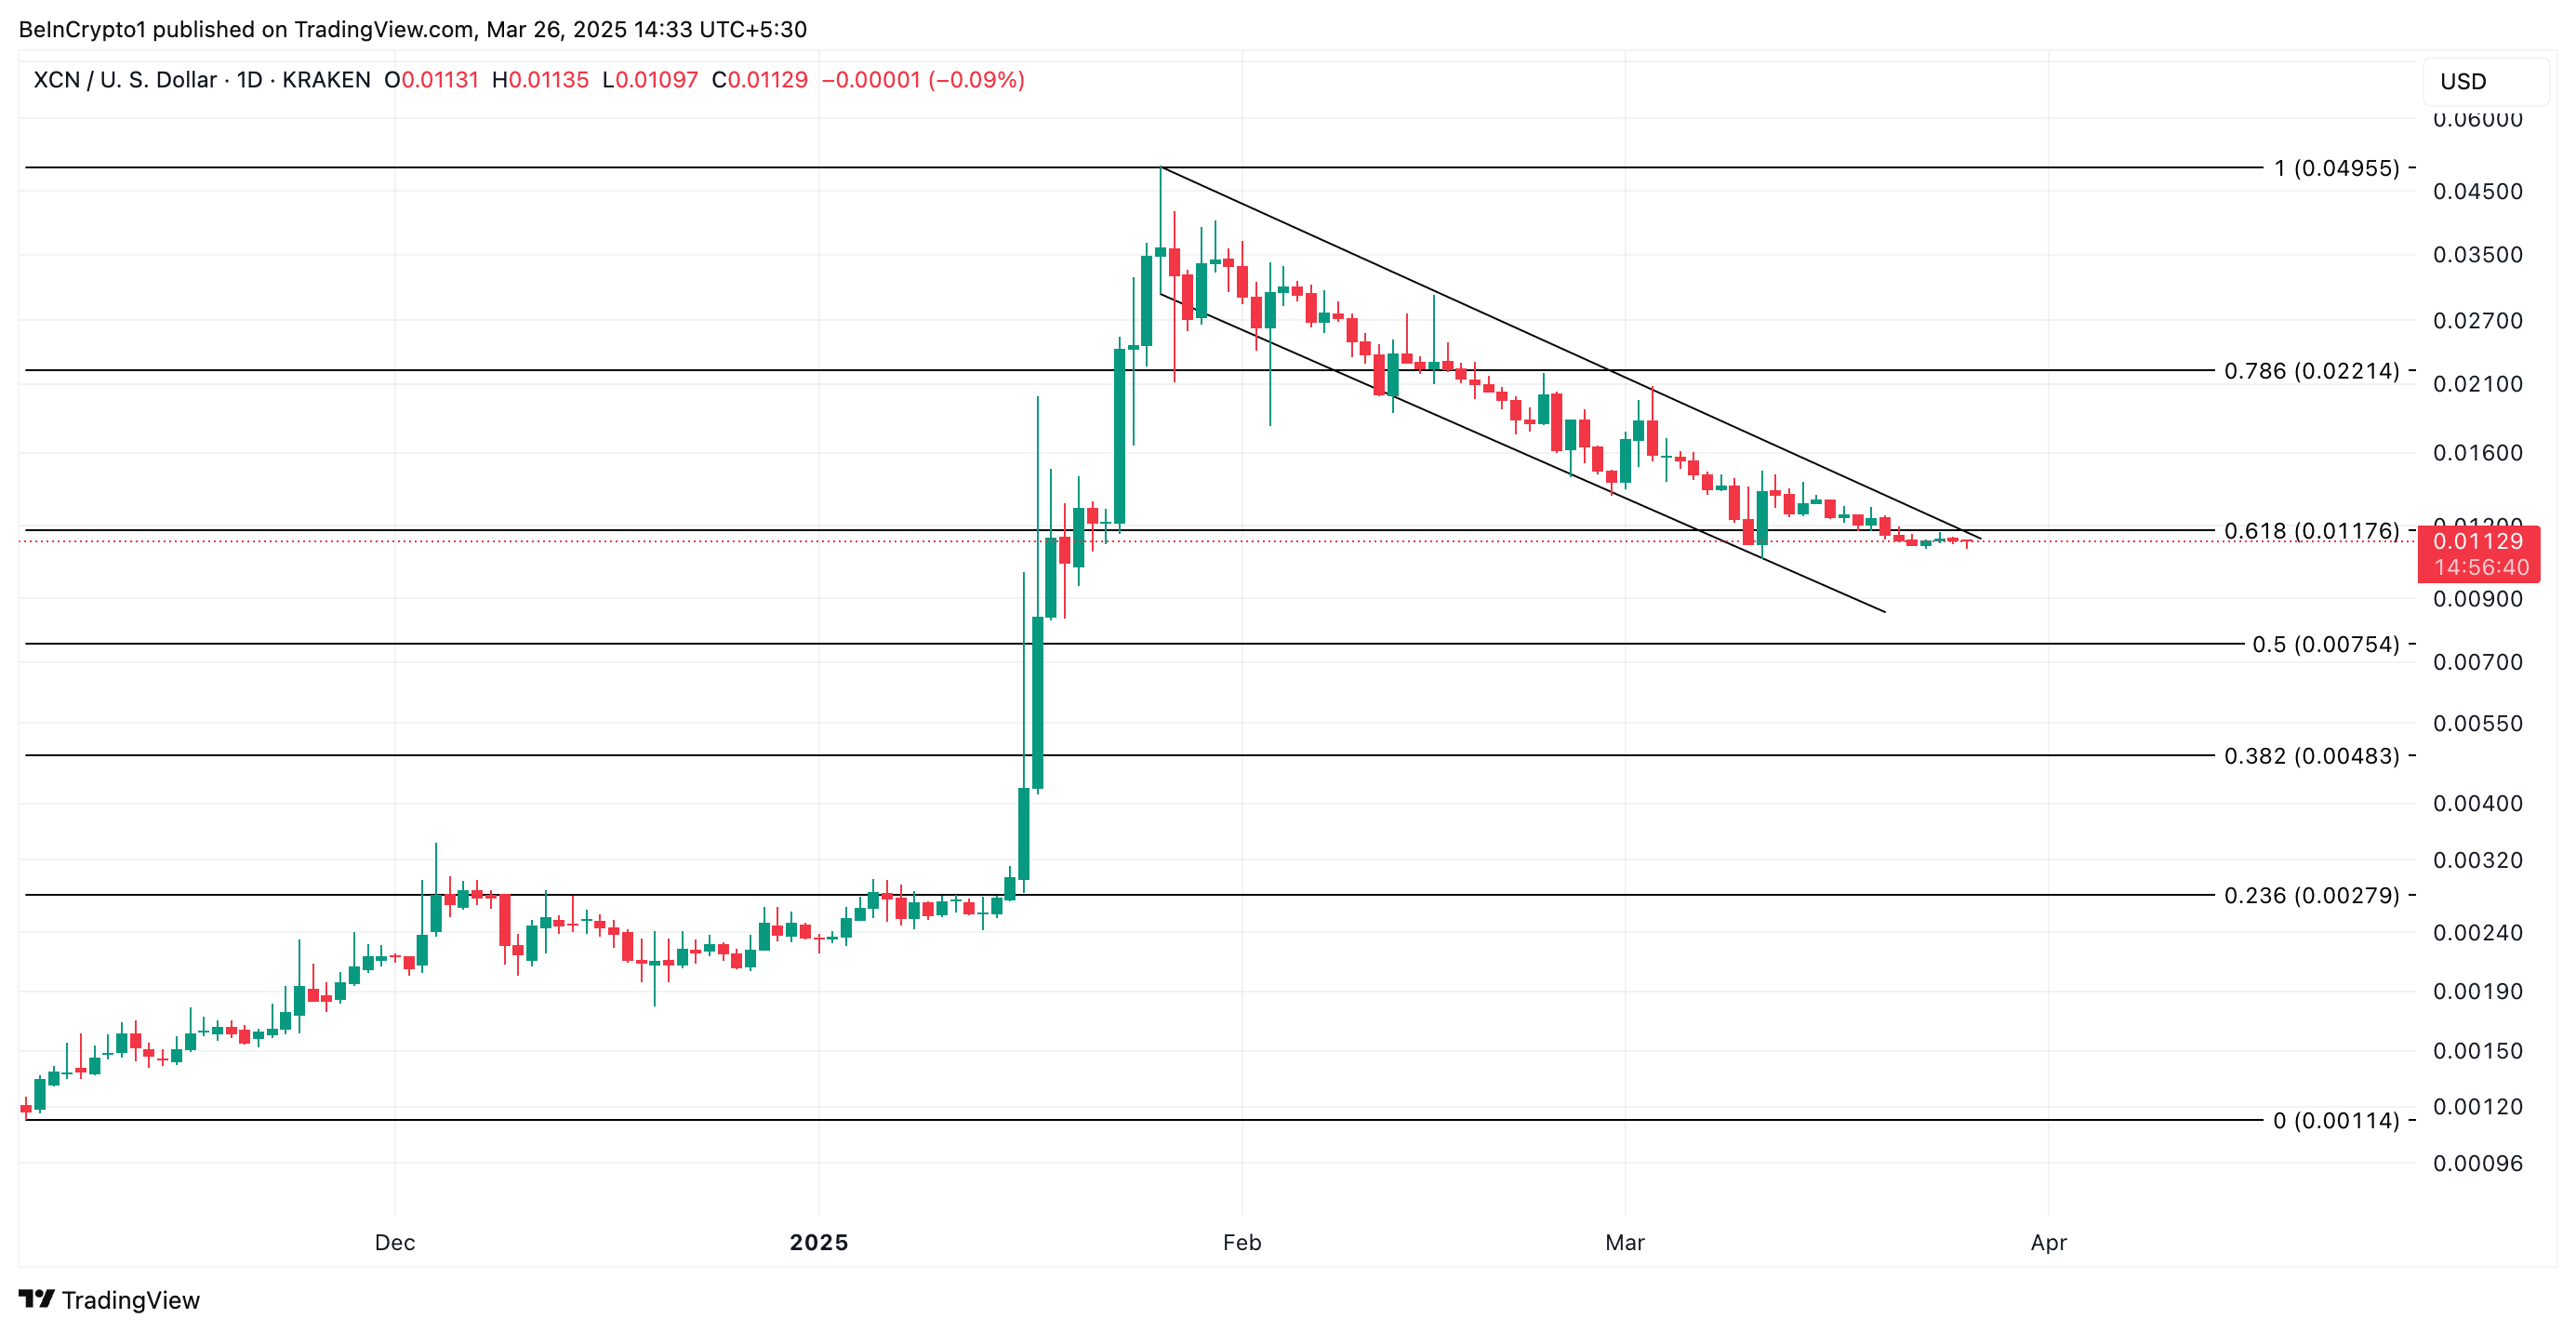
XCN Price Analysis. Source: TradingView

If the downtrend persists, XCN could fall below the lower trend line of its descending channel which forms support at $0.0085. In this scenario, its price could drop lower to $0.0075.

Disclaimer: For information purposes only. Past performance is not indicative of future results.
placeholder
Natural Gas sinks to pivotal level as China’s demand slumpsNatural Gas price (XNG/USD) edges lower and sinks to $2.56 on Monday, extending its losing streak for the fifth day in a row. The move comes on the back of China cutting its Liquified Natural Gas (LNG) imports after prices rose above $3.0 in June. It
Author  FXStreet
Jul 01, 2024
Natural Gas price (XNG/USD) edges lower and sinks to $2.56 on Monday, extending its losing streak for the fifth day in a row. The move comes on the back of China cutting its Liquified Natural Gas (LNG) imports after prices rose above $3.0 in June. It
placeholder
ECB Policy Outlook for 2026: What It Could Mean for the Euro’s Next MoveWith the ECB likely holding rates steady at 2.15% and the Fed potentially extending cuts into 2026, EUR/USD may test 1.20 if Eurozone growth proves resilient, but weaker growth and an ECB pivot could pull the pair back toward 1.13 and potentially 1.10.
Author  Mitrade
Dec 26, 2025
With the ECB likely holding rates steady at 2.15% and the Fed potentially extending cuts into 2026, EUR/USD may test 1.20 if Eurozone growth proves resilient, but weaker growth and an ECB pivot could pull the pair back toward 1.13 and potentially 1.10.
placeholder
WTI eases below $103.50 as US, Iran reportedly seeking 45-day ceasefireWest Texas Intermediate (WTI), the US crude oil benchmark, is trading around $103.30 during the early European trading hours on Monday. The WTI price retreats after reports that the United States (US) and Iran are making a push for a 45-day ceasefire. 
Author  FXStreet
Apr 06, Mon
West Texas Intermediate (WTI), the US crude oil benchmark, is trading around $103.30 during the early European trading hours on Monday. The WTI price retreats after reports that the United States (US) and Iran are making a push for a 45-day ceasefire. 
placeholder
Crypto Weekly Radar: All eyes on Donald Trump’s ultimatum, US macroeconomic dataCrypto markets begin the week with mixed sentiment, with Bitcoin (BTC) trading above $69,000 following last week’s rebound. Still, markets remain cautious as traders weigh risks stemming from Donald Trump’s renewed threats toward Iran ahead of the ultimatum set for Tuesday.
Author  FXStreet
Apr 06, Mon
Crypto markets begin the week with mixed sentiment, with Bitcoin (BTC) trading above $69,000 following last week’s rebound. Still, markets remain cautious as traders weigh risks stemming from Donald Trump’s renewed threats toward Iran ahead of the ultimatum set for Tuesday.
placeholder
WTI Price Forecast: Seems vulnerable near $90.50 as technical breakdown comes into playWest Texas Intermediate (WTI) – the benchmark US Crude Oil price – plummets to a nearly two-week trough during the Asian session on Wednesday in reaction to news that the US and Iran have agreed to a two-week ceasefire.
Author  FXStreet
9 hours ago
West Texas Intermediate (WTI) – the benchmark US Crude Oil price – plummets to a nearly two-week trough during the Asian session on Wednesday in reaction to news that the US and Iran have agreed to a two-week ceasefire.
goTop
quote