

BTC ETF AUM could surpass Gold, expert says, amid enthusiasm for new investment funds

Source Fxstreet
  • Gold’s pain “is like the cherry on top for Bitcoin fans,” Balchunas says, amid euphoria following BTC ETF launches.
  • Bitcoin price has nicked $53,000, a level last tested on December 3, 2021.
  • Almost $40 million shorts have been liquidated in the process alongside nearly $10 million in long positions.

In a landmark decision on January 10, the US Securities & Exchange Commission (SEC) approved multiple spot Bitcoin exchange-traded funds (ETFs) in a single go. Almost seven weeks down the line, the theme continues to drive the cryptocurrency market, giving investors the train to ride on as markets prepare for the BTC halving in 52 days.

Also Read: Bitcoin price's next move should manifest once MicroStrategy grows BTC portfolio to 193K tokens

Bitcoin ETF AUM to surpass Gold

Eric Balchunas, an ETF specialist with Bloomberg Intelligence, says that there is a decent chance that the assets under management (AUM) for Bitcoin ETFs could surpass those of Gold ETFs in less than two years.

This supposition draws from the current lull in the Gold ETF market. According to Balchunas, declines in the price and interest in Gold ETFs is what has come as markets lean toward BTC ETFs. In his opinion, we now have a battle for assets between the two investment products.

It becomes even sweeter as BTC ETFs have managed to amass over $8 billion, according to Balchunas, adding that “[BTC ETFs now command] 40% as much in assets and could surpass Gold in under 24 months.”

Evaluating how Bitcoin ETFs continue to haul in cash as investors bail on Gold, Balchunas details that as BTC ETFs took in about $5 billion in net new assets since they started trading on January 11, Gold ETFs have only managed $3.6 billion in outflows with part of it going to the BTC ETFs.

Balchunas deems Bitcoin ETF class “the most successful launch in history by many measures,” acknowledging that they have added competition for Gold.  A response by X user @wschweitzer corroborates this conclusion.

Almost $40 million in short positions liquidated as Bitcoin price breaches $53,000

Bitcoin price has breached the $53,000 milestone, a level last tested on December 3, 2021. The multi-year high has caught many traders off guard as analysts anticipate a correction before the next leg up.
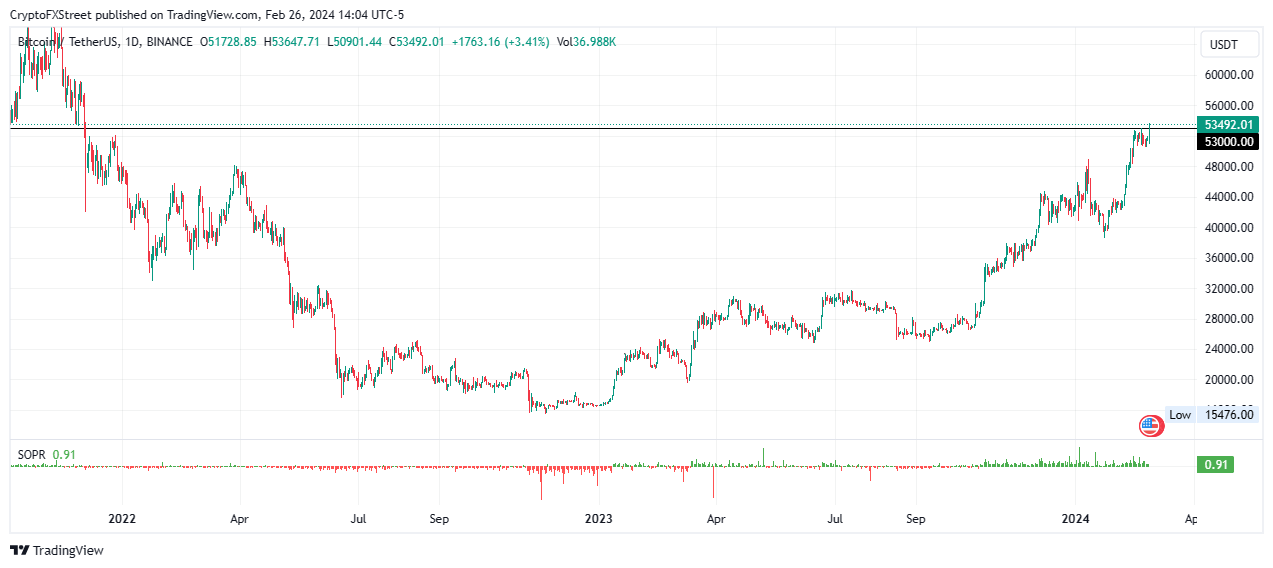
BTC/USDT 1-day chart

Data shows that there are many stop losses around $52,000, which is likely to trigger a foray north in Bitcoin price as shorts close their positions.

Nevertheless, with the foray past $53,000, almost $40 million in short positions have been liquidated alongside $9.5 million longs.
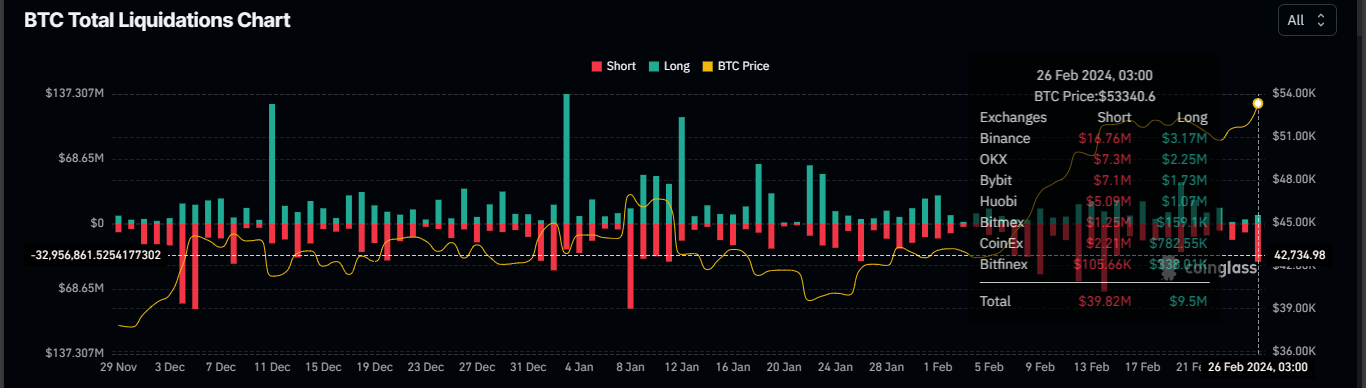
BTC liquidations chart

 At the time of writing, Bitcoin price is trading at $53,492 as of 19:00 GMT. 

Open Interest, funding rate FAQs

How does Open Interest affect cryptocurrency prices?

Higher Open Interest is associated with higher liquidity and new capital inflow to the market. This is considered the equivalent of increase in efficiency and the ongoing trend continues. When Open Interest decreases, it is considered a sign of liquidation in the market, investors are leaving and the overall demand for an asset is on a decline, fueling a bearish sentiment among investors.

How does Funding rate affect cryptocurrency prices?

Funding fees bridge the difference between spot prices and prices of futures contracts of an asset by increasing liquidation risks faced by traders. A consistently high and positive funding rate implies there is a bullish sentiment among market participants and there is an expectation of a price hike. A consistently negative funding rate for an asset implies a bearish sentiment, indicating that traders expect the cryptocurrency’s price to fall and a bearish trend reversal is likely to occur.

Disclaimer: For information purposes only. Past performance is not indicative of future results.
placeholder
Gold Price Analysis Today | Forex Gold Analysis | XAU/USD Analysis - November 11, 2026Get the latest gold price analysis, forex gold insights, and XAU/USD analysis for November 11, 2026. Read on for the details.
Author  Mitrade
Nov 11, Wed
Get the latest gold price analysis, forex gold insights, and XAU/USD analysis for November 11, 2026. Read on for the details.
placeholder
Bitcoin lost its 200-day average — but the exit started three sessions before the CPIBitcoin fell 2.5% to about $73,400 on 11 November, an 11-week low, breaking its 200-day moving average near $73,100. The 24-hour liquidation tally reached $632 to $705 million, roughly 82% of it longs. But spot ETF outflows began three sessions earlier and USDT's market cap has shrunk $6.6 billion in 60 days — the leveraged length left before the inflation print did. A double top at 81,890 and 81,080 leaves a measured target of 69,366.
Author  Suzie
Nov 11, Wed
Bitcoin fell 2.5% to about $73,400 on 11 November, an 11-week low, breaking its 200-day moving average near $73,100. The 24-hour liquidation tally reached $632 to $705 million, roughly 82% of it longs. But spot ETF outflows began three sessions earlier and USDT's market cap has shrunk $6.6 billion in 60 days — the leveraged length left before the inflation print did. A double top at 81,890 and 81,080 leaves a measured target of 69,366.
placeholder
Nvidia slid 7.7% after hours while AMD and Broadcom rose — the AI trade changed hands, it didn't breakNvidia closed Wednesday at 173.73, up 2.87%, then fell as much as 8.1% to 159.44 after reports that its board was preparing for a possible leadership change. The same session, the Philadelphia Semiconductor Index rose 5.7% with all 30 components higher, CoreWeave jumped 24.7% on 168% revenue growth, and Micron added 11.9%. If AI demand were being repriced, AMD and Broadcom would not be bid. This is a governance discount on one name, and 204.54 — the 200-day average — is the level that settles it.
Author  Irene Q.
Nov 12, Thu
Nvidia closed Wednesday at 173.73, up 2.87%, then fell as much as 8.1% to 159.44 after reports that its board was preparing for a possible leadership change. The same session, the Philadelphia Semiconductor Index rose 5.7% with all 30 components higher, CoreWeave jumped 24.7% on 168% revenue growth, and Micron added 11.9%. If AI demand were being repriced, AMD and Broadcom would not be bid. This is a governance discount on one name, and 204.54 — the 200-day average — is the level that settles it.
placeholder
Gold hit a one-year low while central banks bought 321 tonnes — the sellers were never the ones you thinkSpot gold closed at 3,876 on Thursday, down 2.8% and its lowest close in more than a year, with an intraday low near 3,852. The dollar is at a 19-month high of 103.21 and the 10-year yield is at 5.10%, so the price move is easy to explain. What is harder to explain is who sold: central banks bought 321 tonnes in Q3, the PBoC added for a 24th straight month, ETF holdings are near a record 4,256 tonnes, and roughly 95% of the futures selling came from non-reportable and sovereign-type accounts rather than hedge funds. This piece separates the two books that have to balance.
Author  Irene Q.
Yesterday 02: 40
Spot gold closed at 3,876 on Thursday, down 2.8% and its lowest close in more than a year, with an intraday low near 3,852. The dollar is at a 19-month high of 103.21 and the 10-year yield is at 5.10%, so the price move is easy to explain. What is harder to explain is who sold: central banks bought 321 tonnes in Q3, the PBoC added for a 24th straight month, ETF holdings are near a record 4,256 tonnes, and roughly 95% of the futures selling came from non-reportable and sovereign-type accounts rather than hedge funds. This piece separates the two books that have to balance.
placeholder
Brent rose 3.3% and US crude stocks built 4.66 million barrels in the same weekBrent January settled at 95.82, up 3.3%, and WTI at 88.74, up 2.55%, after the US signalled it would not pursue a deal with Iran and attacks on Gulf shipping continued. In the same week, EIA data showed US crude inventories rising 4.657 million barrels against expectations of a 1.1 million draw, with gasoline up another 1.799 million. OPEC output also rebounded 1.96 million barrels a day to 27.16 million in October, led by Saudi Arabia at 10.56 million. This piece separates the geopolitical premium from the physical balance and lays out where each side of the trade is anchored.
Author  Irene Q.
Yesterday 03: 06
Brent January settled at 95.82, up 3.3%, and WTI at 88.74, up 2.55%, after the US signalled it would not pursue a deal with Iran and attacks on Gulf shipping continued. In the same week, EIA data showed US crude inventories rising 4.657 million barrels against expectations of a 1.1 million draw, with gasoline up another 1.799 million. OPEC output also rebounded 1.96 million barrels a day to 27.16 million in October, led by Saudi Arabia at 10.56 million. This piece separates the geopolitical premium from the physical balance and lays out where each side of the trade is anchored.
goTop
quote