

Near Protocol Price Prediction: NEAR pumps 10% as investors envision another buy opportunity here

Source Fxstreet
  • Near Protocol price is up almost 10% as sidelined and late traders join investors in looking for the next entry.
  • NEAR could provide another buying opportunity at the 50% Fibonacci retracement level of $3.34.
  • A break and close below the 50-day SMA at $3.13 would invalidate the bullish thesis.

Near Protocol (NEAR) price is trading with a bullish bias, with a sustained series of higher highs since the last week of January. With investors groping for discounted entry points, NEAR could correct before the next leg up.

Also Read: Near Protocol Price Forecast: NEAR kicks starts its 100% bounce

Near Protocol price to provide another buying opportunity

Near Protocol (NEAR) price is up almost 10% to trade for $3.73 at press time, with early profit booking already underway indicted by the Japanese red candlestick on Sunday.

With the Relative Strength Index (RSI) dropping, signifying falling momentum, Near Protocol price could drop a maximum of 10% to provide another buy opportunity around the 50% Fibonacci retracement level of $3.34.

The Moving Average Convergence Divergence (MACD) indicator remains above its signal line (orange band), with its histogram bars flashing green in positive territory, suggesting the prevalence of a bullish cycle.
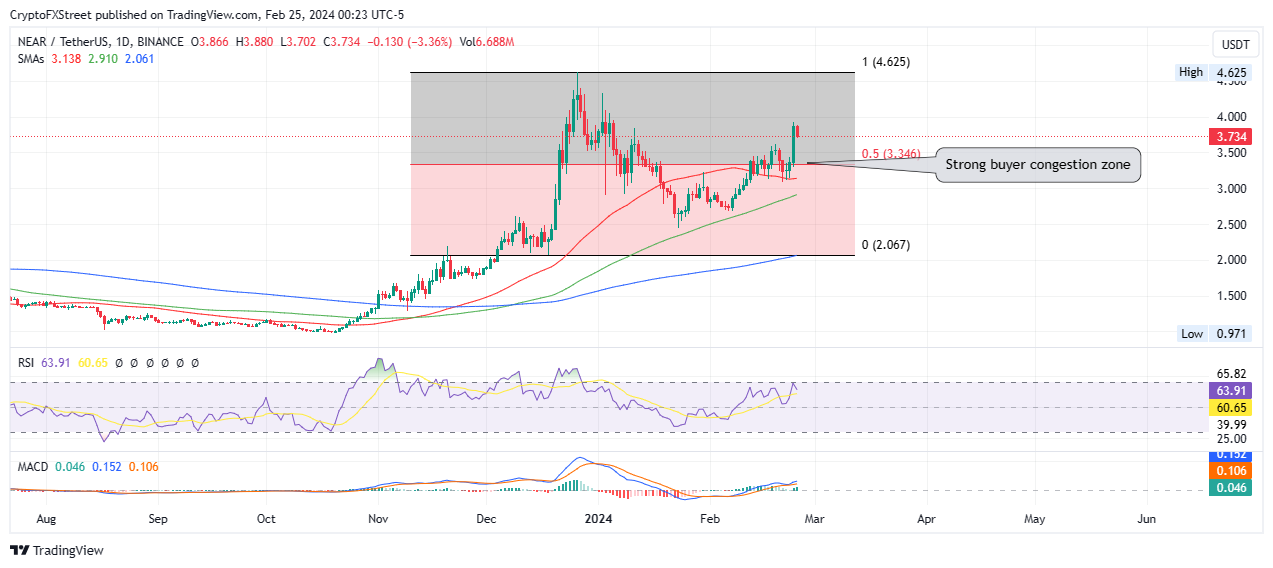
NEAR/USDT 1-day chart

On the other hand, if the Near Protocol price descends below the 50-day Simple Moving Average (SMA) at $3.13, it would not only invalidate the bullish thesis, but also clear the clog for an extended fall.

The next likely support would be due to the 100-day SMA at $2.91, or in a dire case, extend to the foot of the market range at $2.06, levels last tested on December 18. 

Disclaimer: For information purposes only. Past performance is not indicative of future results.
placeholder
Fed hike odds near 90% into Wednesday's decision — how to trade the dollar, gold and the S&P 500A 0.3% monthly core CPI print has lifted the market-implied probability of a 25bp Fed hike on 16 September to roughly 86.5% ~ 90%, which would be the first increase since July 2023. Here is the decision timeline, the pricing versus the forecasts, both scenarios, and the key levels for the dollar, gold and the S&P 500.
Author  Suzie
Sep 14, Mon
A 0.3% monthly core CPI print has lifted the market-implied probability of a 25bp Fed hike on 16 September to roughly 86.5% ~ 90%, which would be the first increase since July 2023. Here is the decision timeline, the pricing versus the forecasts, both scenarios, and the key levels for the dollar, gold and the S&P 500.
placeholder
Silver breaks $64 as precious metals rebound — can gold hold the $4,280 line into the Fed decision?Silver has climbed back above $64 an ounce for the first time this week, leading a broad rebound across precious metals hours before the Federal Reserve delivers what is expected to be its first rate hike since 2023. Spot silver was last at $64.64, up 1.49% on the day, while gold reclaimed $4,300 and platinum and palladium both advanced. The question now is whether the bounce is a genuine turn — or a pause before the Fed's dot plot decides the next move.
Author  Suzie
Sep 16, Wed
Silver has climbed back above $64 an ounce for the first time this week, leading a broad rebound across precious metals hours before the Federal Reserve delivers what is expected to be its first rate hike since 2023. Spot silver was last at $64.64, up 1.49% on the day, while gold reclaimed $4,300 and platinum and palladium both advanced. The question now is whether the bounce is a genuine turn — or a pause before the Fed's dot plot decides the next move.
placeholder
Dollar index tops 100 for the first time since July as the Fed's hawkish dot plot sinks inThe U.S. dollar index broke back above 100 for the first time since 31 July after the Fed delivered its first rate hike since 2023, with the dot plot showing 16 of 18 officials expect at least one more increase this year. Here are the levels that matter for DXY, the currencies feeling it most, and what to watch next.
Author  Irene Q.
Sep 17, Thu
The U.S. dollar index broke back above 100 for the first time since 31 July after the Fed delivered its first rate hike since 2023, with the dot plot showing 16 of 18 officials expect at least one more increase this year. Here are the levels that matter for DXY, the currencies feeling it most, and what to watch next.
placeholder
Gold rebounds to near $4,350 on weaker US Dollar, falling oil pricesGold price (XAU/USD) rises to near $4,345 during the early Asian session on Friday. The precious metal rebounds from a six-week low amid falling oil prices and a weaker US Dollar (USD). Traders continue to assess the latest Federal Reserve (Fed) rate hike and policy cues.
Author  FXStreet
Yesterday 01: 32
Gold price (XAU/USD) rises to near $4,345 during the early Asian session on Friday. The precious metal rebounds from a six-week low amid falling oil prices and a weaker US Dollar (USD). Traders continue to assess the latest Federal Reserve (Fed) rate hike and policy cues.
placeholder
US to delay new "overcapacity" tariffs on China — what the pause means for trade, inflation and the dollarWashington is expected to hold off announcing new tariffs over Chinese "overcapacity" until after the 24 September summit, according to Bloomberg. The postponed plan would have added 7.5% to Chinese goods, taking second-term US tariffs to around 20%. Here is what is on the table, and what a deal versus no deal would mean for the yuan, Hong Kong equities and the dollar.
Author  Mitrade
20 hours ago
Washington is expected to hold off announcing new tariffs over Chinese "overcapacity" until after the 24 September summit, according to Bloomberg. The postponed plan would have added 7.5% to Chinese goods, taking second-term US tariffs to around 20%. Here is what is on the table, and what a deal versus no deal would mean for the yuan, Hong Kong equities and the dollar.
goTop
quote