


Bitcoin’s Ongoing Dip: Here’s What Analysts Are Saying
Bitcoin’s price has continued its decline, dropping below several key levels in recent days. As of now, Bitcoin is hovering just above $87,000, marking a weekly drop of around 7.7% and a 19.6% decline from its all-time high of over $109,000 recorded earlier this year.
Amid this downturn, various market analysts have taken to social media to weigh in on the possible causes of the dip and what might come next for the flagship cryptocurrency.
Diverging Predictions for Bitcoin’s Next Move
First on the list is crypto analyst Titan of Crypto who recently shared his perspective on X, suggesting that Bitcoin’s monthly close could offer important clues. “As long as BTC holds above the 38.2% Fibonacci retracement, the bull run remains intact,” the analyst noted.
Notably, in traditional and crypto markets alike, a monthly close is considered a significant indicator because it reflects sustained market sentiment over a longer timeframe. A strong monthly close above key technical levels can signal ongoing strength, while a close below such thresholds may point to further declines.
Prominent trader Gareth Soloway offered a wide-ranging forecast, indicating that Bitcoin could either fall to $75,000 or surge to $125,000 in the coming months.
Gareth Soloway says Bitcoin is either going to $75K or $125K, he could be wrong, he doesn’t know. And yes it could still go to $200K by EOY. Incredible analysis. pic.twitter.com/tLCVSL4WuA
— The ₿itcoin Therapist (@TheBTCTherapist) February 25, 2025
Other analysts have taken a more bearish stance. Coinmamba, another well-known figure in the crypto community, highlighted the waning influence of MicroStrategy’s large Bitcoin purchases.
“The only reason we had this much Bitcoin outperformance was due to MicroStrategy buys, and that is coming to an end,” Coinmamba wrote, adding that he is bullish on altcoins but bearish on Bitcoin’s near-term prospects.
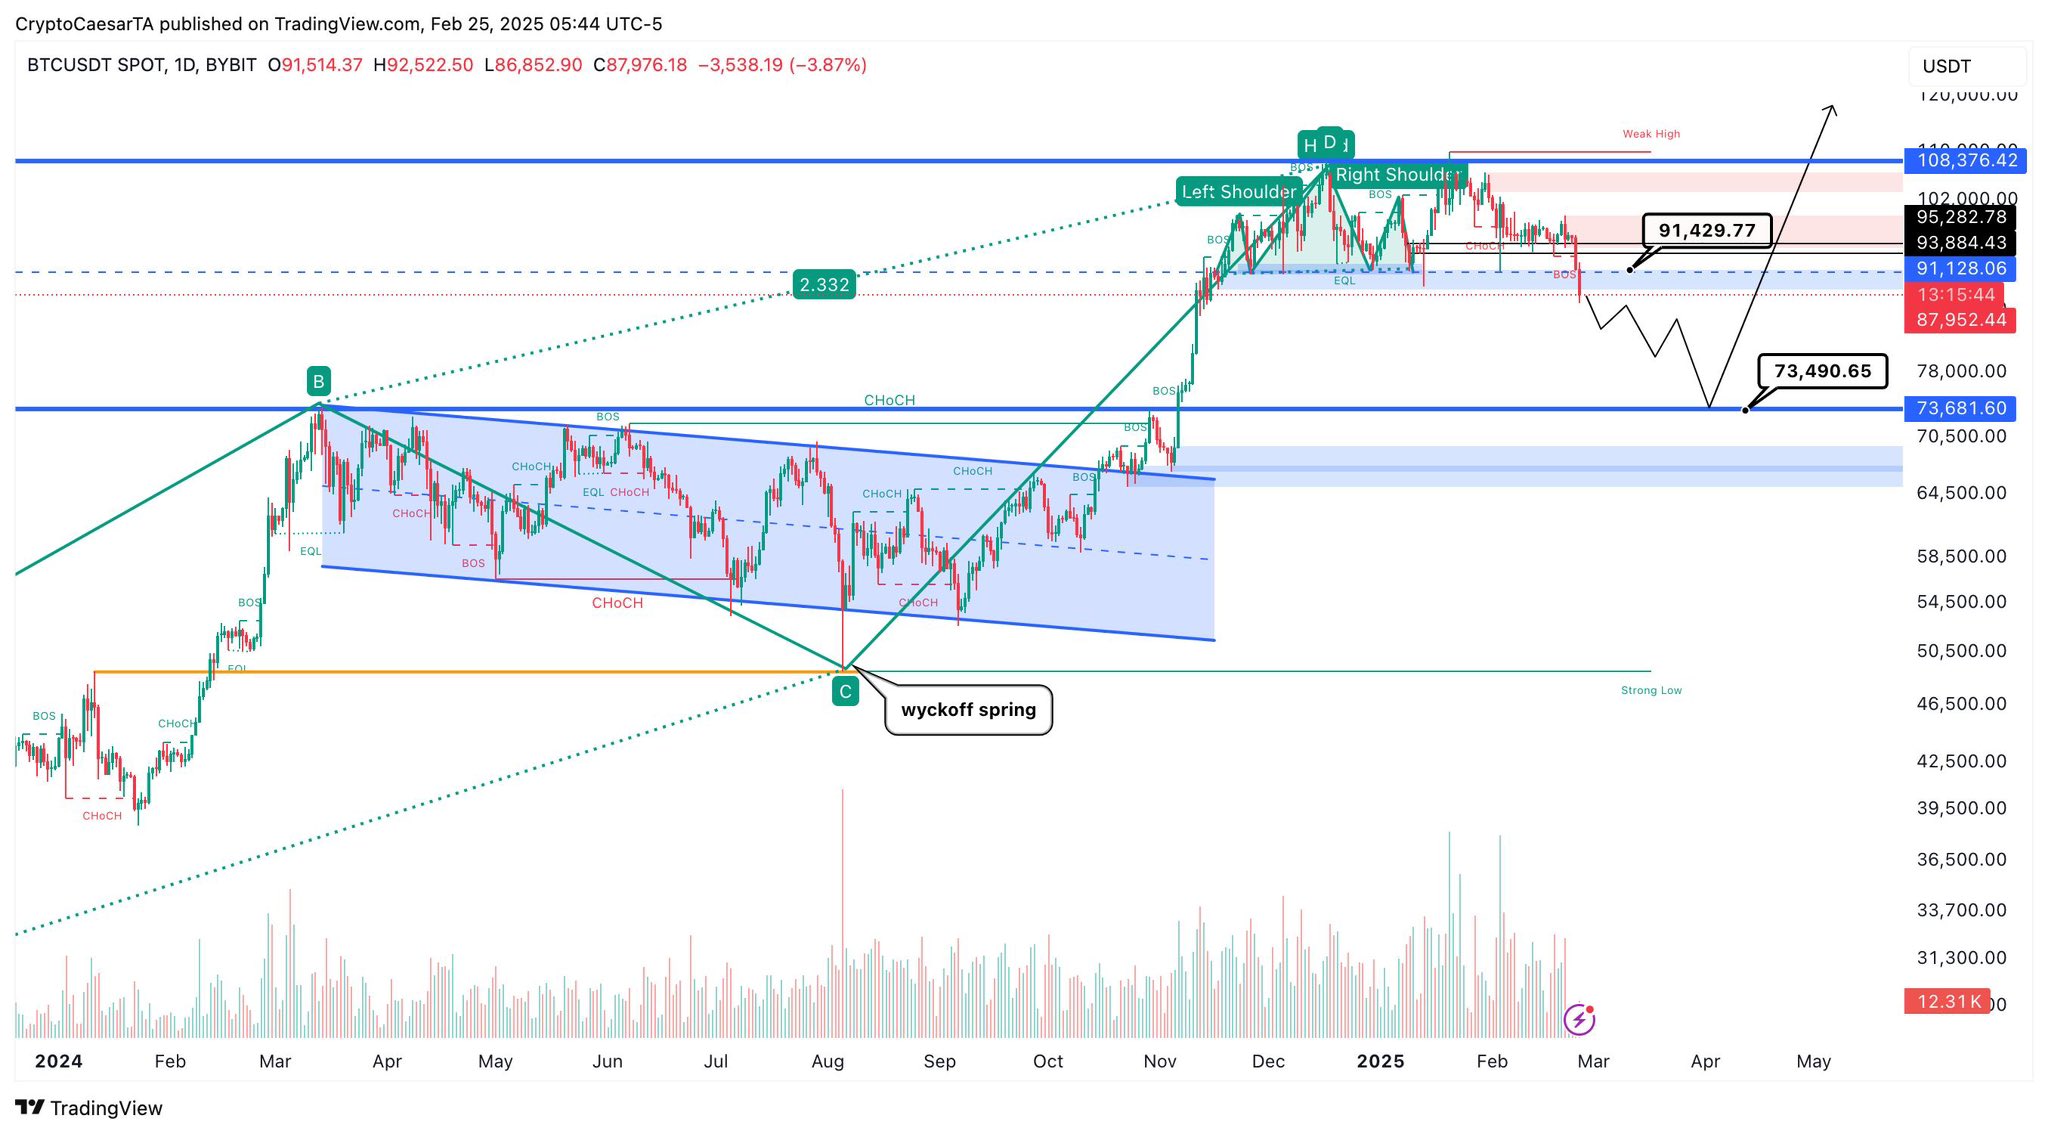
Meanwhile, Crypto Caesar suggested a possible drop to $73,000 levels, citing a mix of technical and fundamental indicators that point to further downside potential.
Optimism Amid the Bearish Sentiment
Despite the bearish outlook from some analysts, a number of investors remain confident in Bitcoin’s long-term trajectory. Max Brown, expressed strong conviction on X, stating, “Bitcoin is going to $150K. ETH is going to $15,000. Don’t let anyone tell you otherwise. We will hold tight and ride our coins to 10x–50x.”
This sentiment, while ambitious, highlights the resilience of some Bitcoin holders who view current price declines as temporary setbacks rather than structural weaknesses.
Similarly, an investor known as Lemon shared a simple strategy for navigating the current downturn: “I will start buying every day on every dip, from $85K to $75K. I’ll sell by the end of the year above $110–$120K.”
My plan for the rest of the year.
I will start buying every day on every dip, from 85K to 75K, I will sell by the end of the year above 110-120K.#Bitcoin $BTC pic.twitter.com/gLYJ2G7mui
— Lemon
(@TheCryptoLemon) February 25, 2025
This approach, emphasizing steady accumulation and a clear exit strategy, reflects a more measured form of optimism among Bitcoin’s long-term supporters.
Featured image created with DALL-E, Chart from TradingView
Recommended Articles


