Uniswap launches v2 on Arbitrum, Polygon, Optimism, Base, Binance Smart Chain and Avalanche
- Uniswap v2 enables swaps on six chains and users can access it from a single interface.
- UNI price declined nearly 4% on Wednesday to $7.309.
- UNI price could revisit 2024’s peak at $7.972 as on-chain metrics support uptrend.
Uniswap, a decentralized crypto exchange, launched on Wednesday its version 2 (v2) on six chains: Arbitrum, Polygon, Optimism, Base, Binance Smart Chain and Avalanche. Uniswap’s v2 pools allow users to swap assets in a single-user interface and minimize the need for upfront decision-making or active liquid pooling activities.
On-chain metrics support UNI’s weekly gains, making it likely thatpricerevisits its 2024 peak.
Also read: Ripple CEO slams SEC says the regulator has lost consistently, XRP price sustains above $0.55
Uniswap price could rally riding on two catalysts
Two key catalysts could drive Uniswap gains: the rollout of v2 on six chains and bullish on-chain metrics. The decentralized exchange announced that users can access its DEX on six leading blockchains, opening up its DEX to an array of users in the ecosystem. Uniswap explained that despite version 3’s availability users prefer v2 for its simplicity.
While v3 offers more advanced capabilities for active liquidity providers, v2 pools cover the entire price range and reduce upfront decision-making required by users, making it more lucrative for market participants, Uniswap said.
This development could catalyze gains in UNI price as it could boost the adoption of the DEX’s native token and its utility.
Looking at on-chain metrics, the supply on exchanges data shows a decline in UNI reserves across exchange platforms. UNI supply dropped from 70.59 million on January 19 to 67.9 million on February 21. Generally, lower supply on exchanges is considered as a bullish sign as it means that traders are holding the token into their wallets and thus are less likely to sell it.
%20[12.34.20,%2021%20Feb,%202024]-638441031163048634.png)
UNI Supply on Exchanges. Source: Santiment
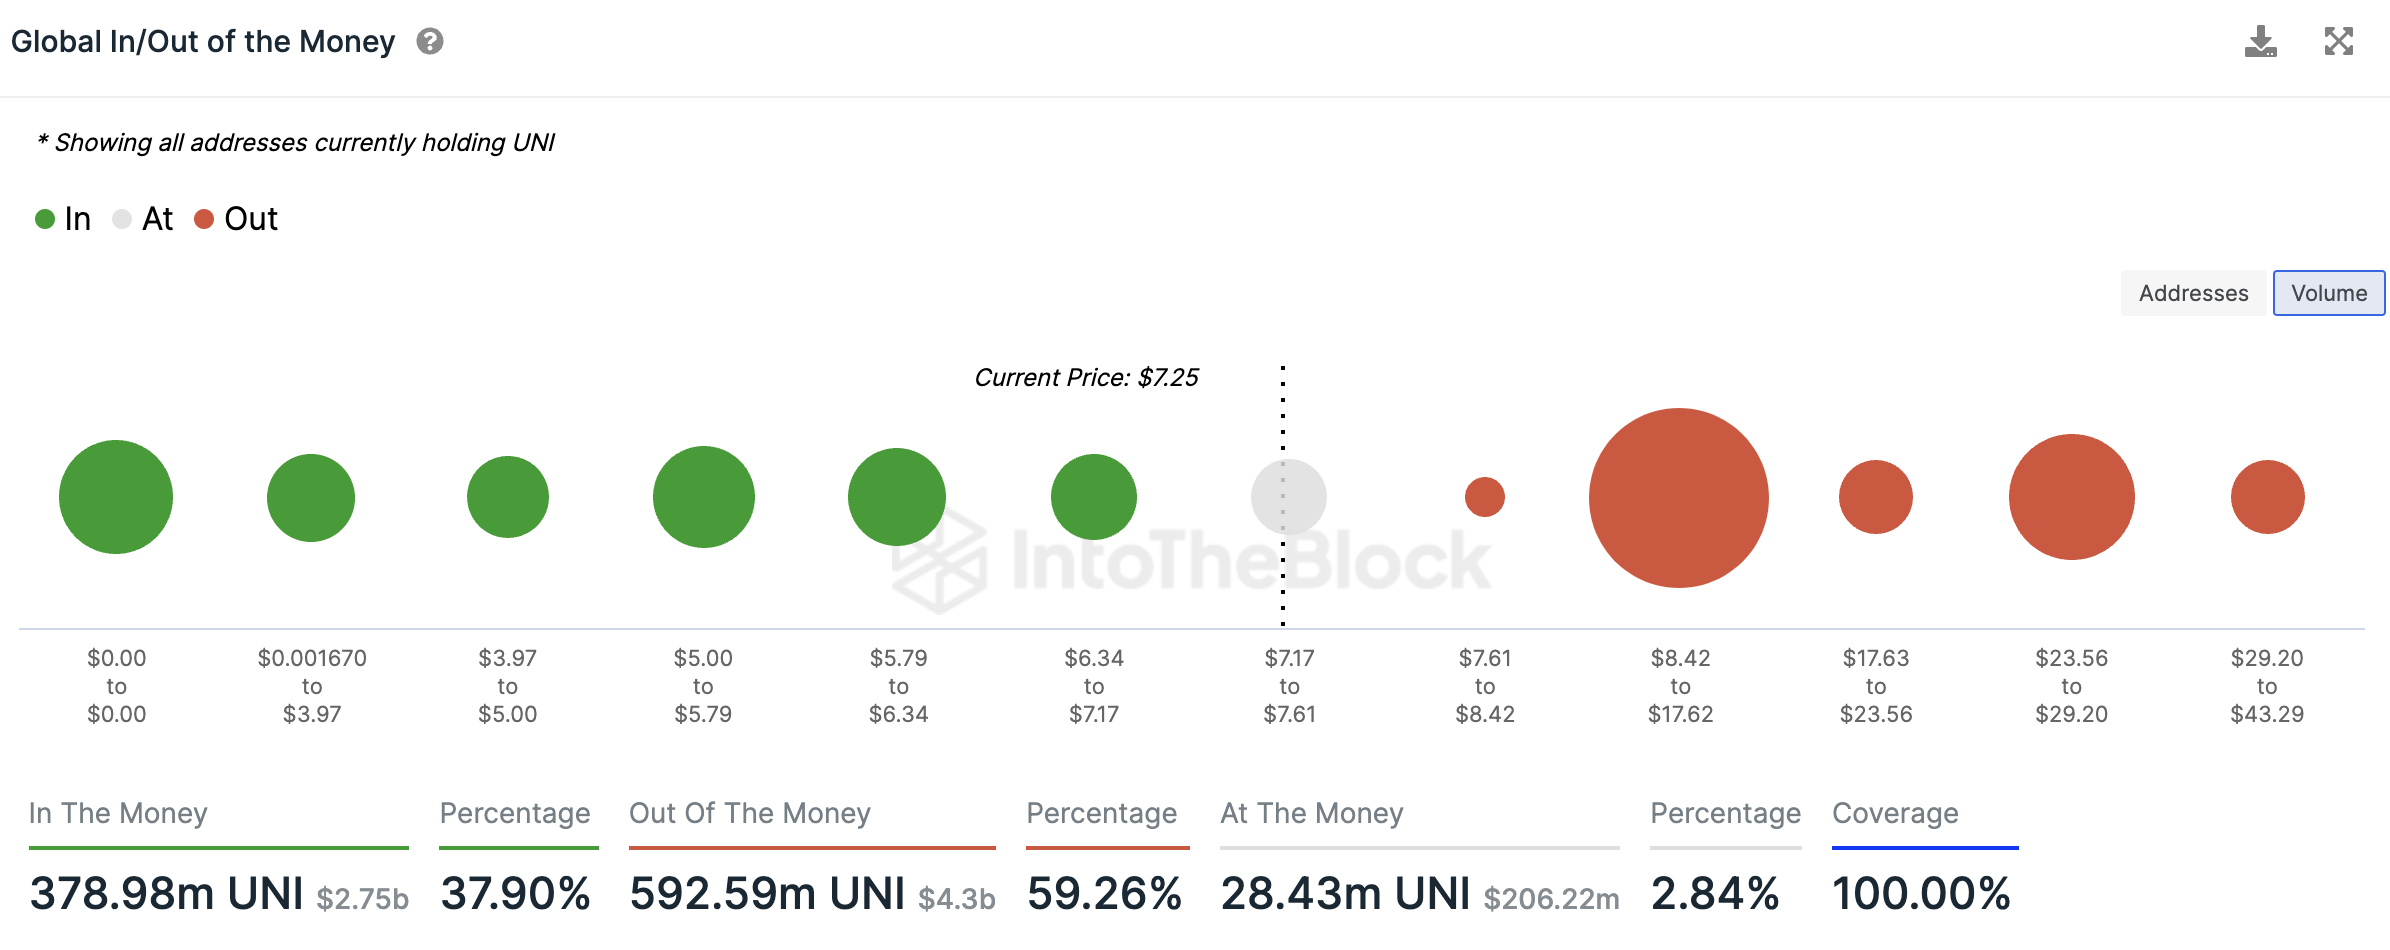
According to data from IntoTheBlock, at the current price, 59.26% of UNI holders are underwater or sitting on unrealized losses. As the likelihood of traders realizing losses is low, selling pressure on UNI could remain limited.

Global In/Out of the Money. Source: IntoTheBlock
UNI price could revisit its 2024’s high
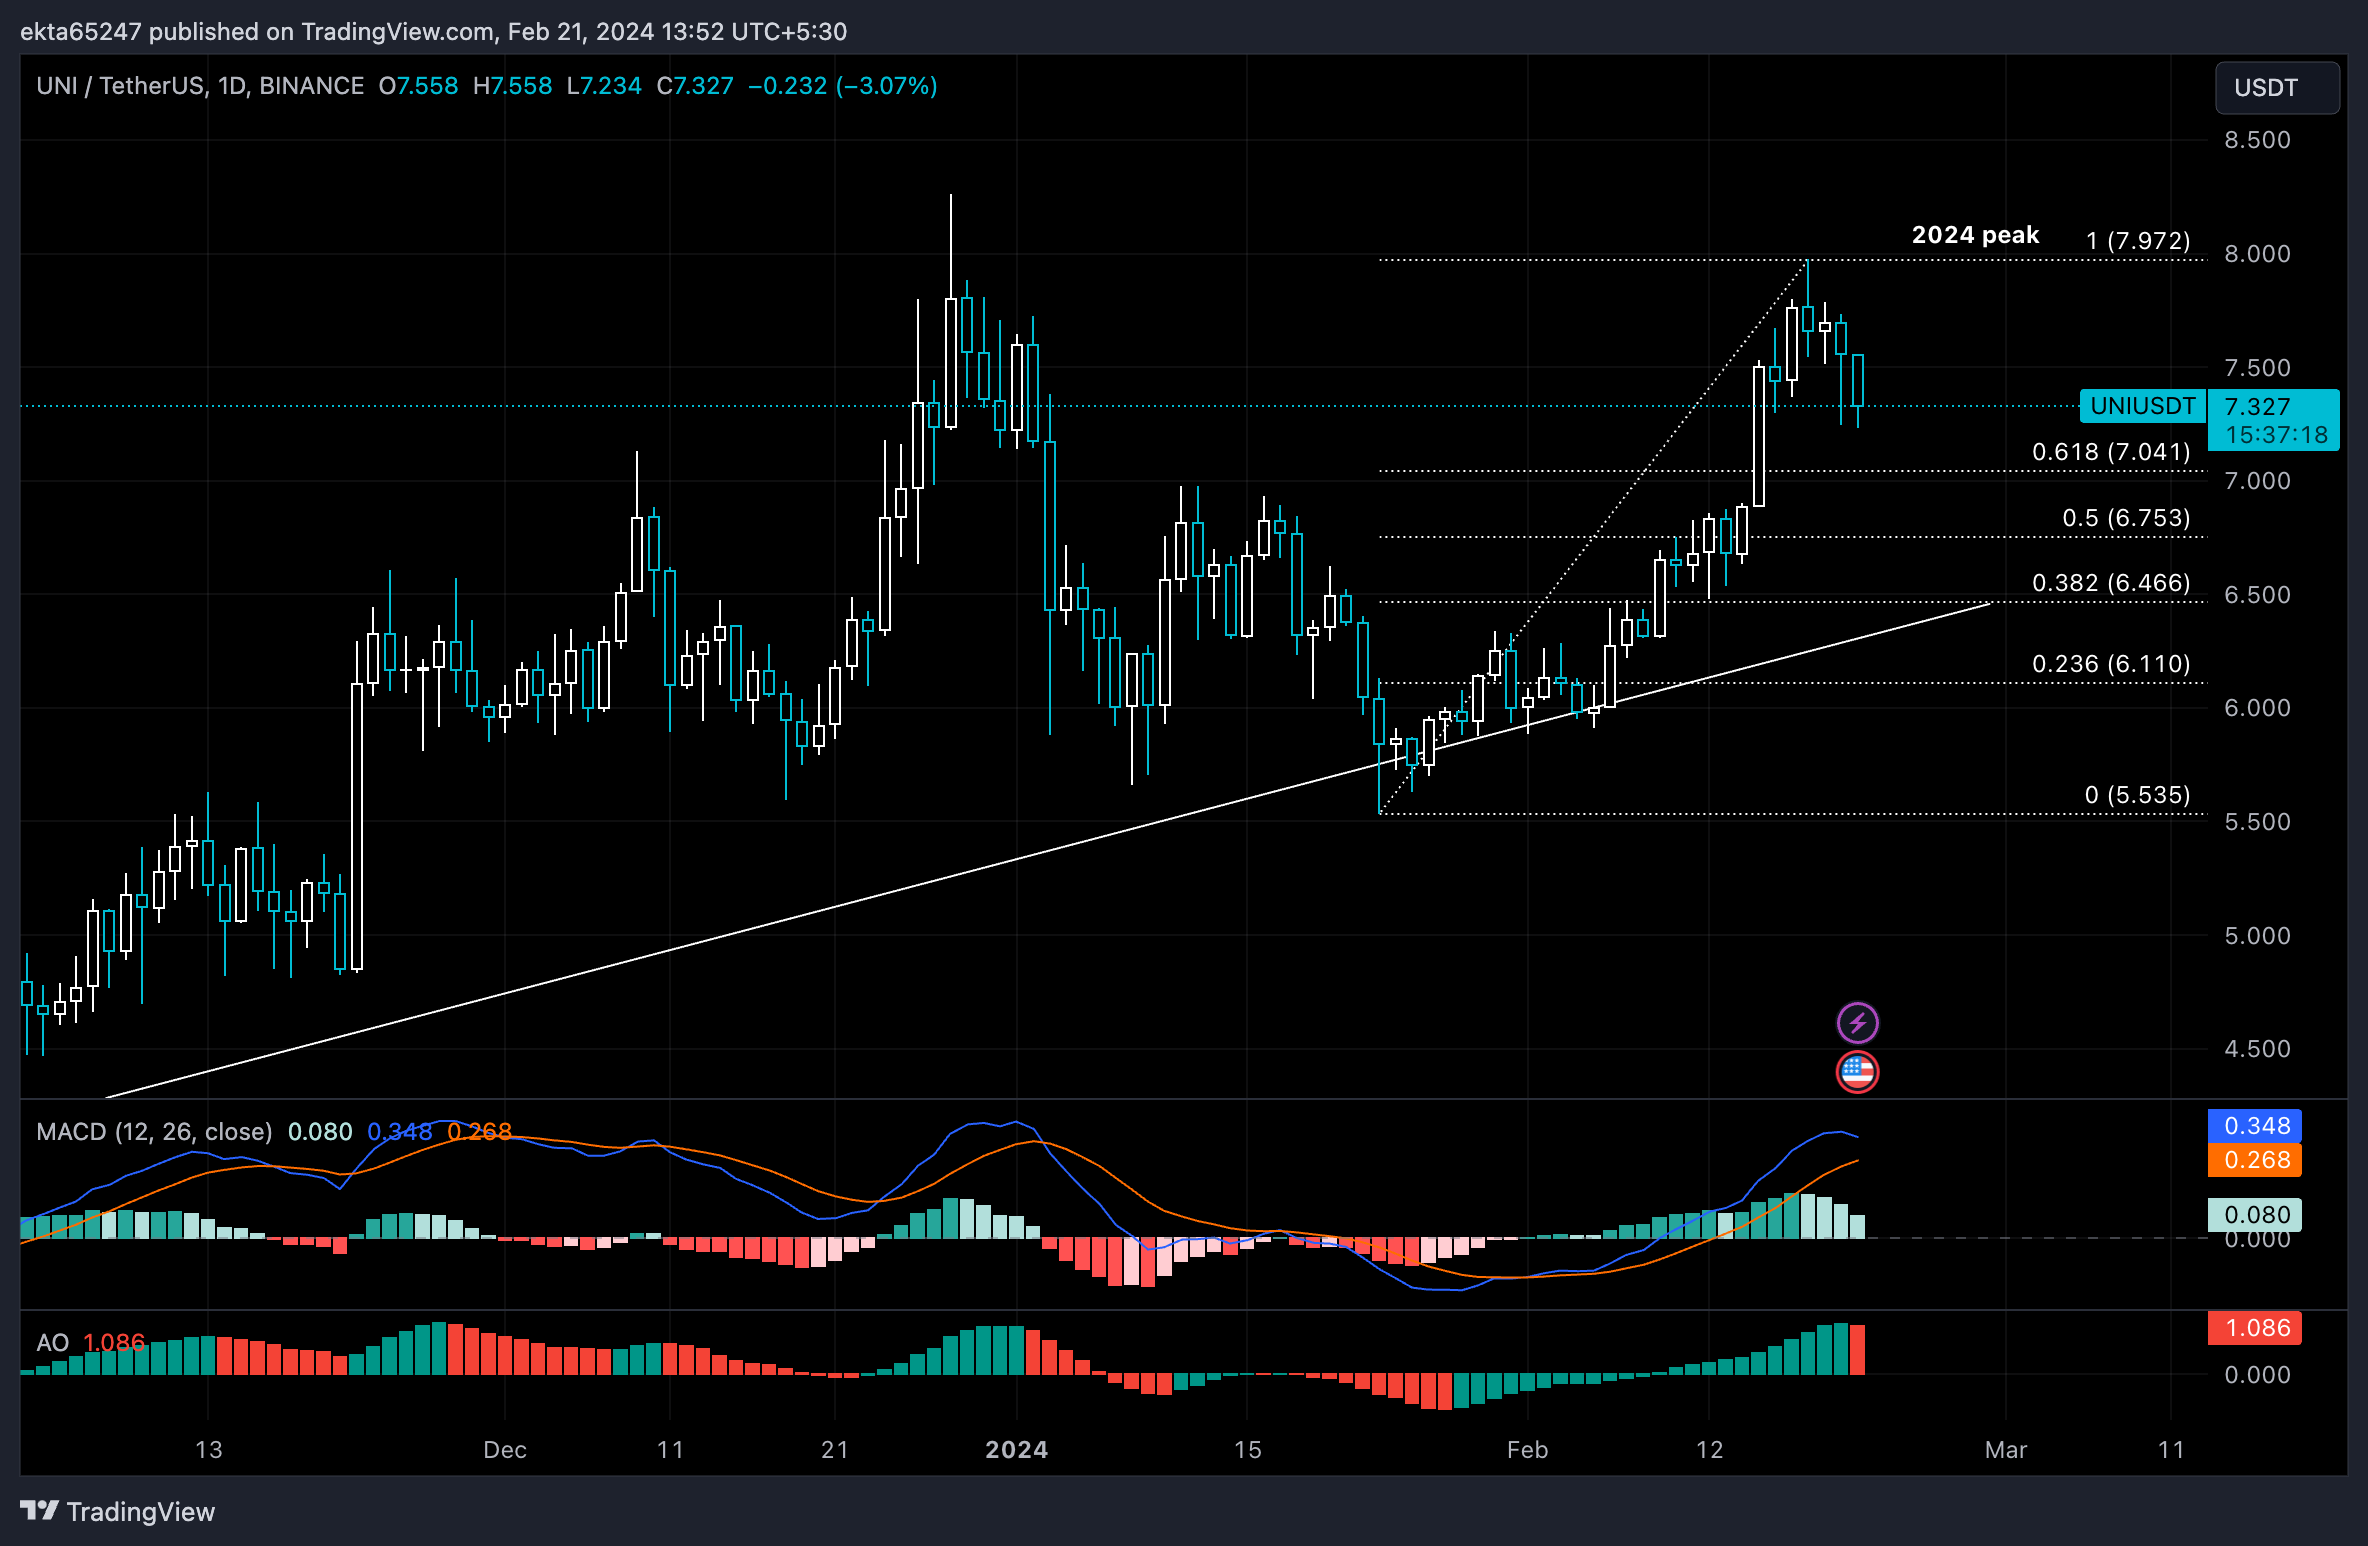
UNI price is currently in an uptrend. UNI price hit its 2024 peak of $7.972 on Sunday.. UNI could find support at at $7.041 and $6.753, the 61.8% and 50% Fibonacci retracement levels, respectively, of the recent rise to $7.972.
The green bars on the Moving Average Convergence/Divergence (MACD) indicator signal there is positive momentum in UNI. This supports UNI’s price gains. However, the red bar on the Awesome Oscillator (AO) signals that there is a likelihood of a correction.
A sweep of support at 61.8% or 50% Fibonacci retracement is likely before UNI price resumes its rally.

UNI/USDT 1-day chart
In the event of a daily candlestick close below support at $7.041, the bullish outlook could be invalidated. UNI price would find support at $6.466, $6.753 before resuming its rally towards $7.972.


