

Why Litecoin Won’t Break Out—Analytics Firm Reveals the Cause
The market intelligence platform IntoTheBlock has explained the reason why Litecoin has been stuck inside the $90 to $130 range recently.
Litecoin Exchange Netflow Has Followed An Interesting Pattern Recently
In a new post on X, the analytics firm IntoTheBlock has discussed about a pattern that the Litecoin Exchange Netflow has shown during the recent phase of consolidation in the asset’s price.
The “Exchange Netflow” here refers to an on-chain indicator that keeps track of the net amount of the cryptocurrency that’s entering into or exiting the wallets associated with all centralized exchanges.
When the value of this metric is positive, it means the inflows for these platforms outweigh the outflows. Generally, one of the main reasons why investors would deposit their coins into the custody of exchanges is for selling-related purposes, so this kind of trend can be a bearish sign for LTC’s price.
On the other hand, the indicator being under zero suggests the holders are withdrawing a net number of tokens from the exchanges. Such a trend can be a sign that the investors are in a phase of accumulation, which can naturally have a bullish impact on the asset.
Now, here is the chart shared by IntoTheBlock, which shows the trend in the Litecoin Exchange Netflow over the last few months:
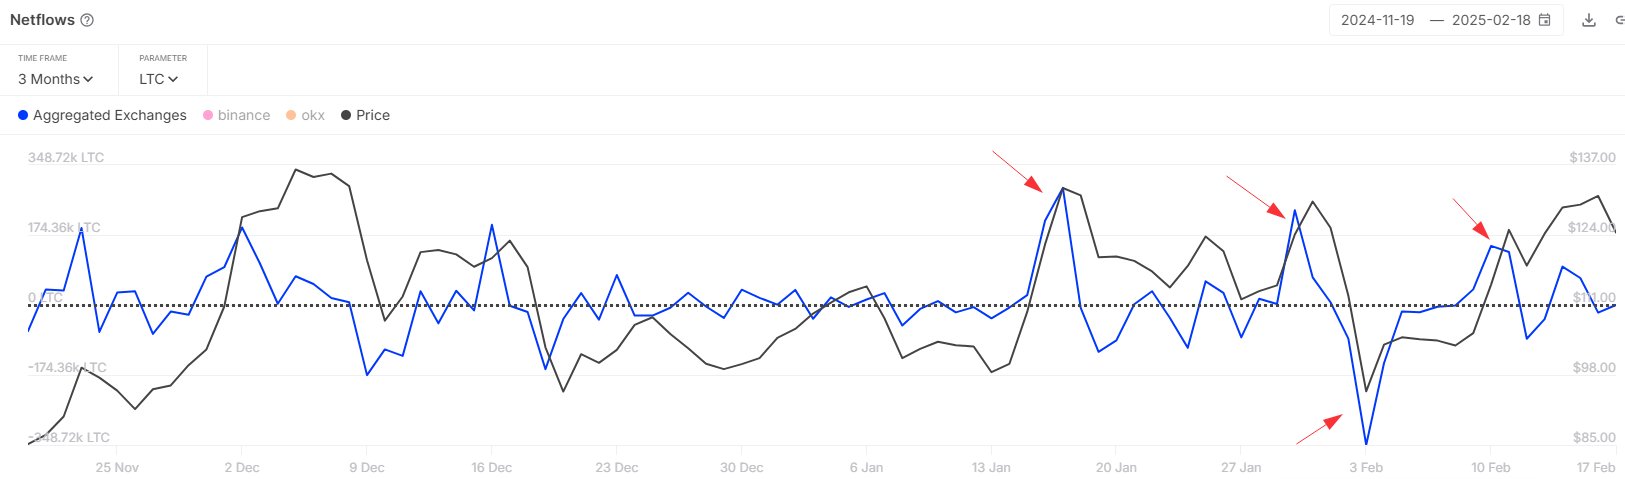
As is visible in the above graph, the LTC Exchange Netflow has displayed an interesting pattern during the last couple of months. It would seem that deposits have ramped up when the cryptocurrency has gone up to retest the $130 upper level of its recent consolidation range, while outflows have occurred during dips.
“Data suggests Litecoin traders are capitalizing on price swings, ramping up withdrawals and deposits to sell on spikes and buy on dips,” notes the analytics firm. “This pattern has helped keep LTC trading in a range between 90 and 130 for about three months.”
Given this trend, it’s possible that the cryptocurrency would have trouble escaping out of this range, so as long as the whales continue to trade in this manner. Thus, the Exchange Netflow could be kept an eye on, to check when trader behavior finally shifts.
At present, Litecoin is trading quite near the upper level of the sideways channel, but the Exchange Netflow is still at a neutral level (that is, the inflows are balancing out the outflows). It only remains to be seen whether this is a sign that the whales are switching things up, or if it’s only a temporary deviation.
LTC Price
Most of the cryptocurrency sector has found the past day to be a red one, but Litecoin has shown divergence as its price has jumped almost 3%, reaching the $127 mark.
Recommended Articles


