

Chainlink (LINK) price fails another $20 breakout test as BTC stagnation drains market momentum
- Chainlink (LINK) price has failed to breach the $20 resistance over the past week since forming a local bottom at $17 on February 10.
- Chainlink’s Top 1,000 largest investors acquired LINK tokens worth over $28 million since February 3, capitalizing on declining prices.
- Despite a 1% decline on Monday, seven of the top ten largest projects in the Real World Asset (RWA) protocols maintain sizable gains in the seven-day timeframe.
Chainlink (LINK) price has plunged 6% in the last 24 hours hitting $17.8 as bulls failed another attempt to breach the $20 resistance. On-chain data trends suggest steady whale demand could keep LINK price above the $17 local bottom formed in the near term.
Chainlink (LINK) price down 6% as macro tailwinds trigger volatility
Chainlink (LINK) has benefitted from growing institutional interest in Real World Asset (RWA) tokenization, a sector that has surged in adoption over recent weeks.
As a key provider of oracle price feeds for on-chain financial instruments, Chainlink’s role in the ecosystem remains pivotal, but its price action has been heavily influenced by broader market trends.
The altcoin started the week on a strong note, buoyed by bullish sentiment surrounding the United States (US) Securities and Exchange Commission’s (SEC) acknowledgment of new ETF filings for Dogecoin and Ripple (XRP).
However, Bitcoin’s failure to sustain upward momentum has stifled market-wide gains.
BTC dropped to a three-day low of $95,800 on Monday, with investors reallocating capital into select altcoins, including Chainlink.
This BTC stagnation has hampered broader market sentiment, preventing a sustained breakout above $20 for LINK.
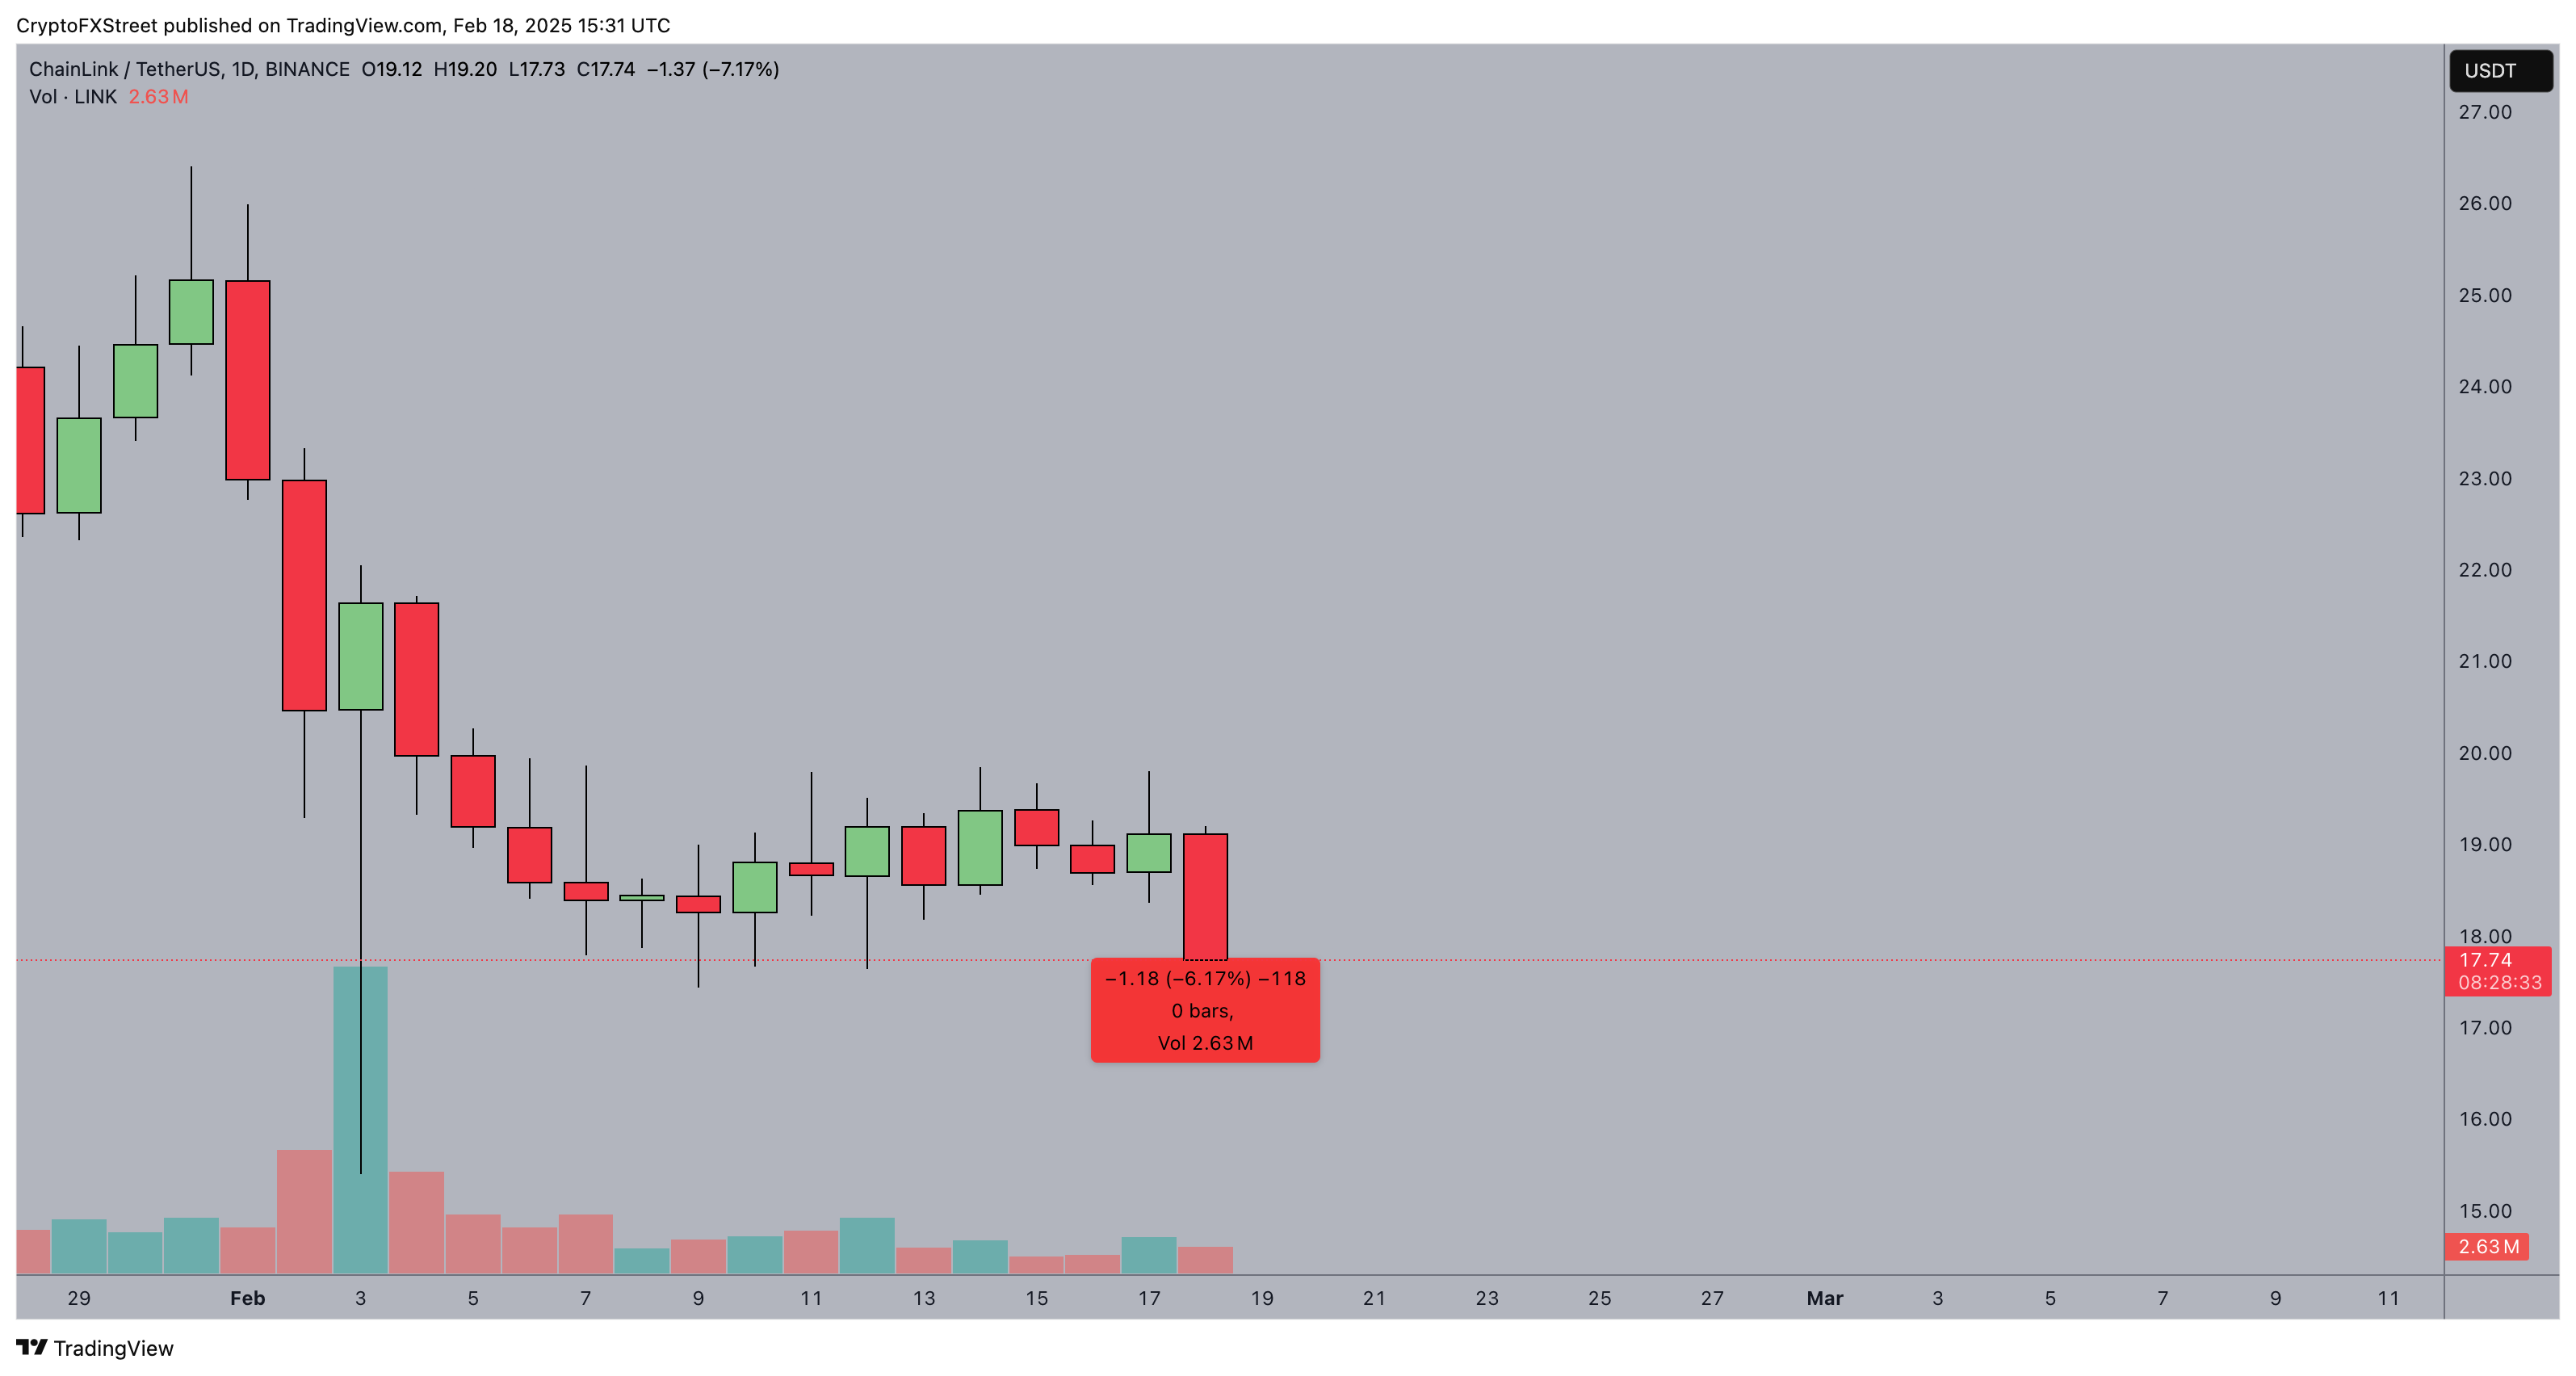
Chainlink (LINK) Price Action | Source: TradingView
As a result, Chainlink price sharply rejected the $20 resistance level on Monday, plunging 6% to reach $17.8 at press time on Tuesday.
The downturn suggests that in the absence of fresh capital inflows—whether in the form of renewed BTC demand or increased stablecoin issuance—altcoins like LINK may continue experiencing heightened volatility.
The current market environment favors capital rotation, with speculative traders cycling liquidity among different assets for short-term gains, while more strategic investors remain on the sidelines. Declining trading volumes reinforce this cautious stance, as liquidity constraints weigh on LINK's ability to stage a breakout.
Whales spotted buying $28M LINK amid RWA sector rally
Following its latest failed breakout attempt, Chainlink has entered a notable 6% correction, but on-chain data suggests that large investors remain actively engaged in accumulating LINK.
Whale accumulation could provide a crucial support mechanism, mitigating further downside risk.
Blockchain analytics firm Santiment reports that top holders—measured by the net balance of the 1,000 largest Chainlink wallets—have steadily increased their holdings since the start of February. Notably, LINK whales added 1.6 million LINK tokens between February 3 and February 17, raising their total balance from 669.9 million to 671.5 million tokens.
Valued at current prices of $18 per token, this whale has effectively spent $28 million buying the dip over the last two weeks.
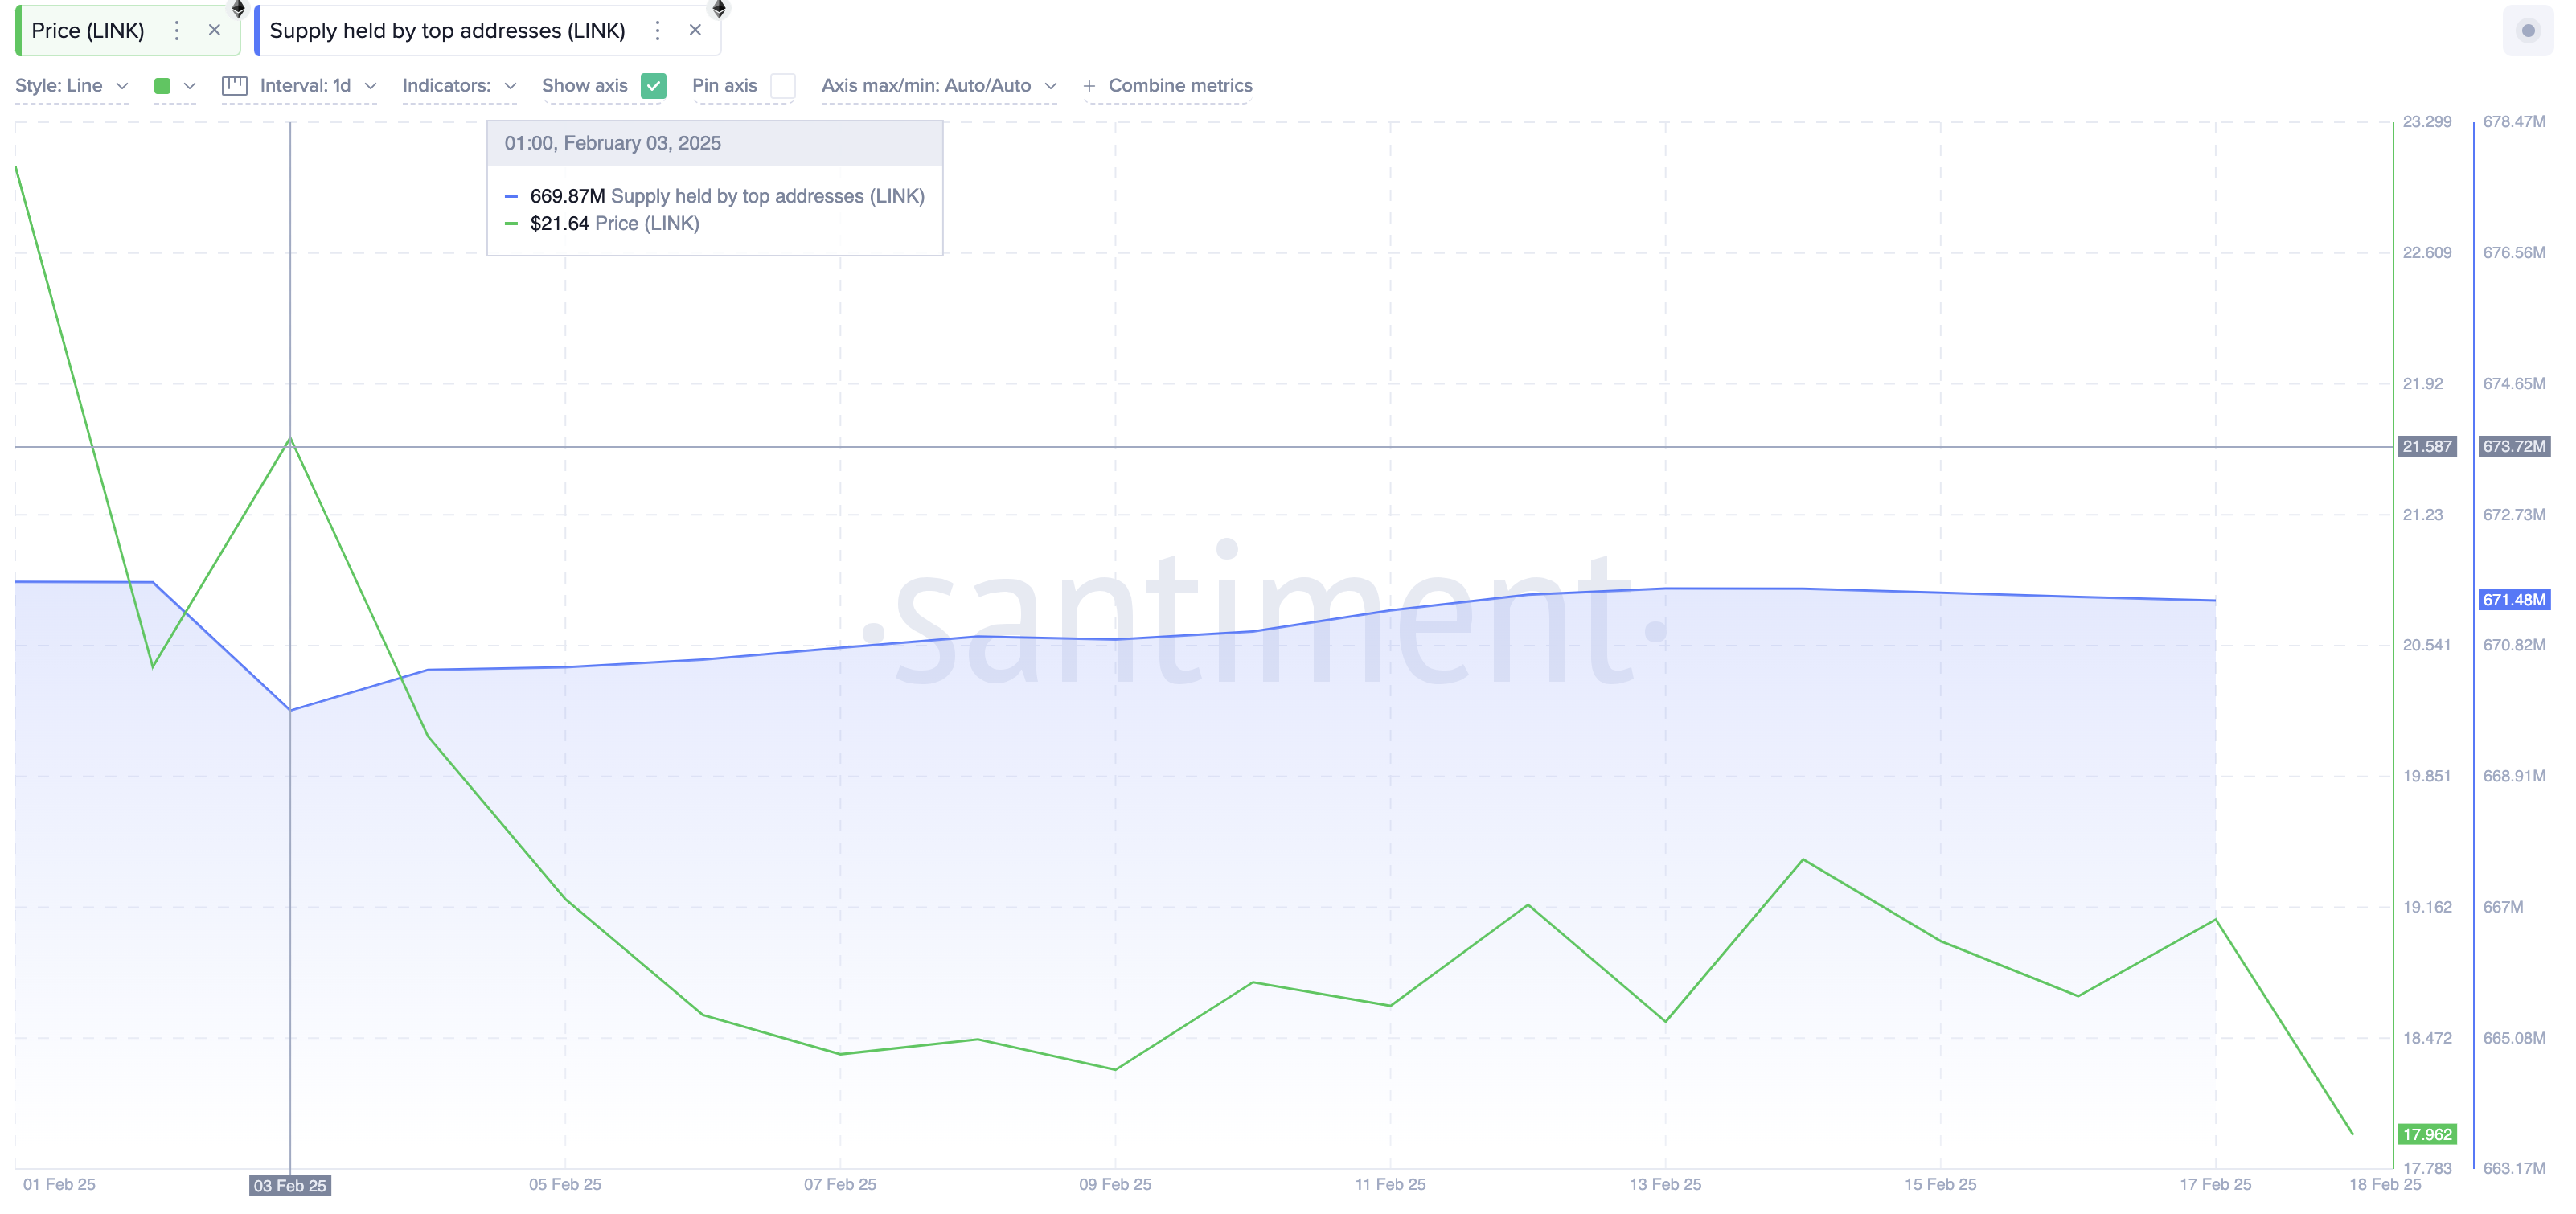
Chainlink (LINK) Top 1,000 Holders’ Wallet Balances | Source: TradingView
Historically, sustained whale buying pressure has acted as a stabilizing force in Chainlink’s price.
Whales capitalizing on declining prices to strengthen their positions often signal a belief in long-term upside potential.
As seen in previous accumulation cycles, whale support can prevent excessive drawdowns, particularly in times of market inactivity.
With seven of the top ten Real World Asset protocols maintaining gains over the past week, Chainlink’s fundamental relevance in tokenized asset pricing could further bolster investor confidence.
Beyond that, the persistent whale demand could provide a much-needed buffer against negative social sentiment, discouraging aggressive short selling and limiting the severity of downward movements.
While broader market trends will continue to shape short-term price action, the $28 million inflows from the top 1,000 holders over the last two weeks suggest that Chainlink remains a preferred asset among large investors, reinforcing its long-term growth prospects.
Chainlink Price Forecast: $17 support set to hold steady
Chainlink (LINK) price has dropped 6.85% in the past 24 hours, currently trading at $17.81, testing a crucial support level.
The daily chart reveals that despite the bearish engulfing candlestick, LINK remains above the 200-day simple moving average (SMA) at $16.23, which has historically provided strong support. Meanwhile, the 50-day SMA at $21.31 looms as resistance, indicating that bulls must regain momentum to prevent extended consolidation.
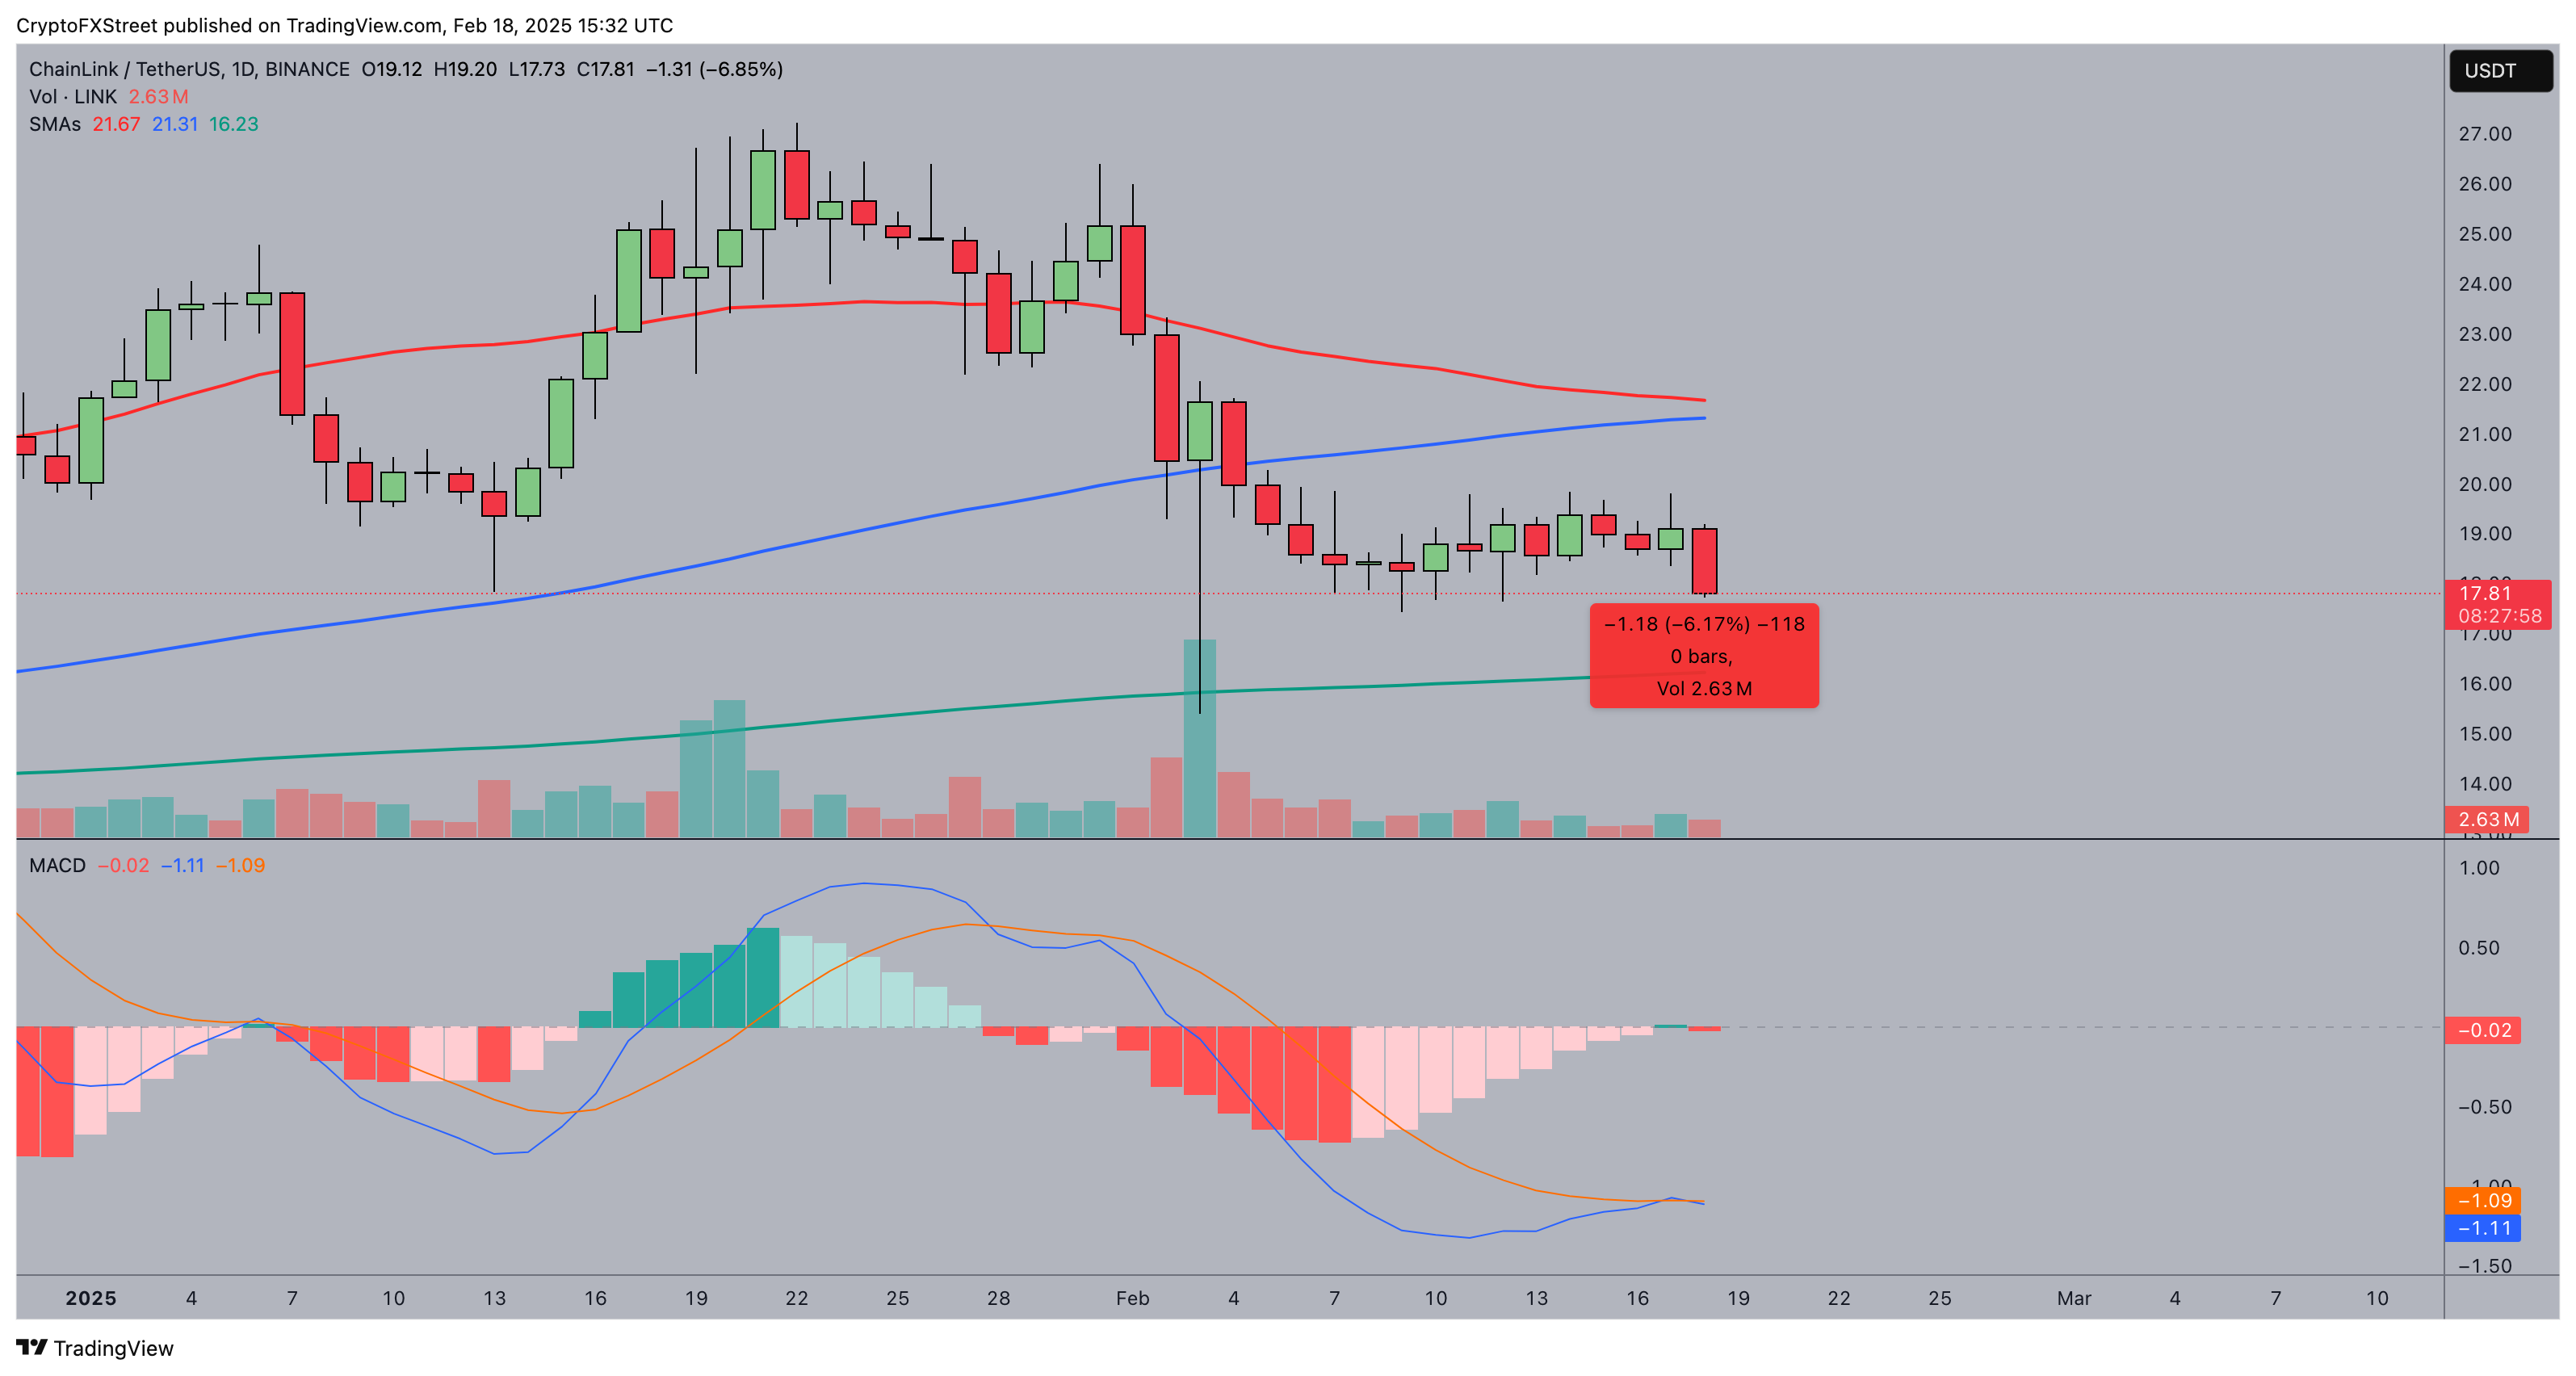
Chainlink Price Forecast: (LINKUSD)
The MACD indicator shows intensifying bearish momentum, with the MACD line crossing below the signal line.
However, the histogram's declining negative bars suggest waning selling pressure.
If buyers step in at the $17 support zone, LINK could consolidate and push toward the $19.20 resistance before challenging the psychological $20 level once again.
On the contrary, a breakdown below $17 with increasing volume could see LINK extend losses toward $16, aligning with the 200-day SMA.
The next few trading sessions will be critical in determining whether whale accumulation can sustain price stability or if broader market weakness pulls LINK lower.
For now, cautious optimism prevails, with $17 remaining a key level to watch.
Recommended Articles


