

Cardano (ADA) Price Jumps 15% In a Week, But Whales Are Yet to Show Confidence

Source Beincrypto

Cardano (ADA) price is showing signs of recovery, up more than 4% in the last 24 hours and over 15% for the week, as it tries to bounce back from a 24% loss over the past 30 days. Its market cap now stands at $29 billion, while trading volume has surged over 100% in the last day, reaching $895 million.

Despite this rebound, whale activity remains stable, indicating that large holders are not aggressively accumulating yet. If ADA maintains its momentum and forms a golden cross, it could push toward $1.16, but failure to hold support may trigger another downturn.

ADA ADX Shows the Trend Could Be Changing

Cardano ADX has risen to 21.7 from 16.2 in just one day, signaling a strengthening trend.

The ADX (Average Directional Index) measures trend strength on a scale from 0 to 100, with values below 20 indicating a weak trend and above 25 suggesting a strong one. Since ADA’s ADX has now crossed 20, it suggests growing momentum, though it is not yet in a fully confirmed trend.
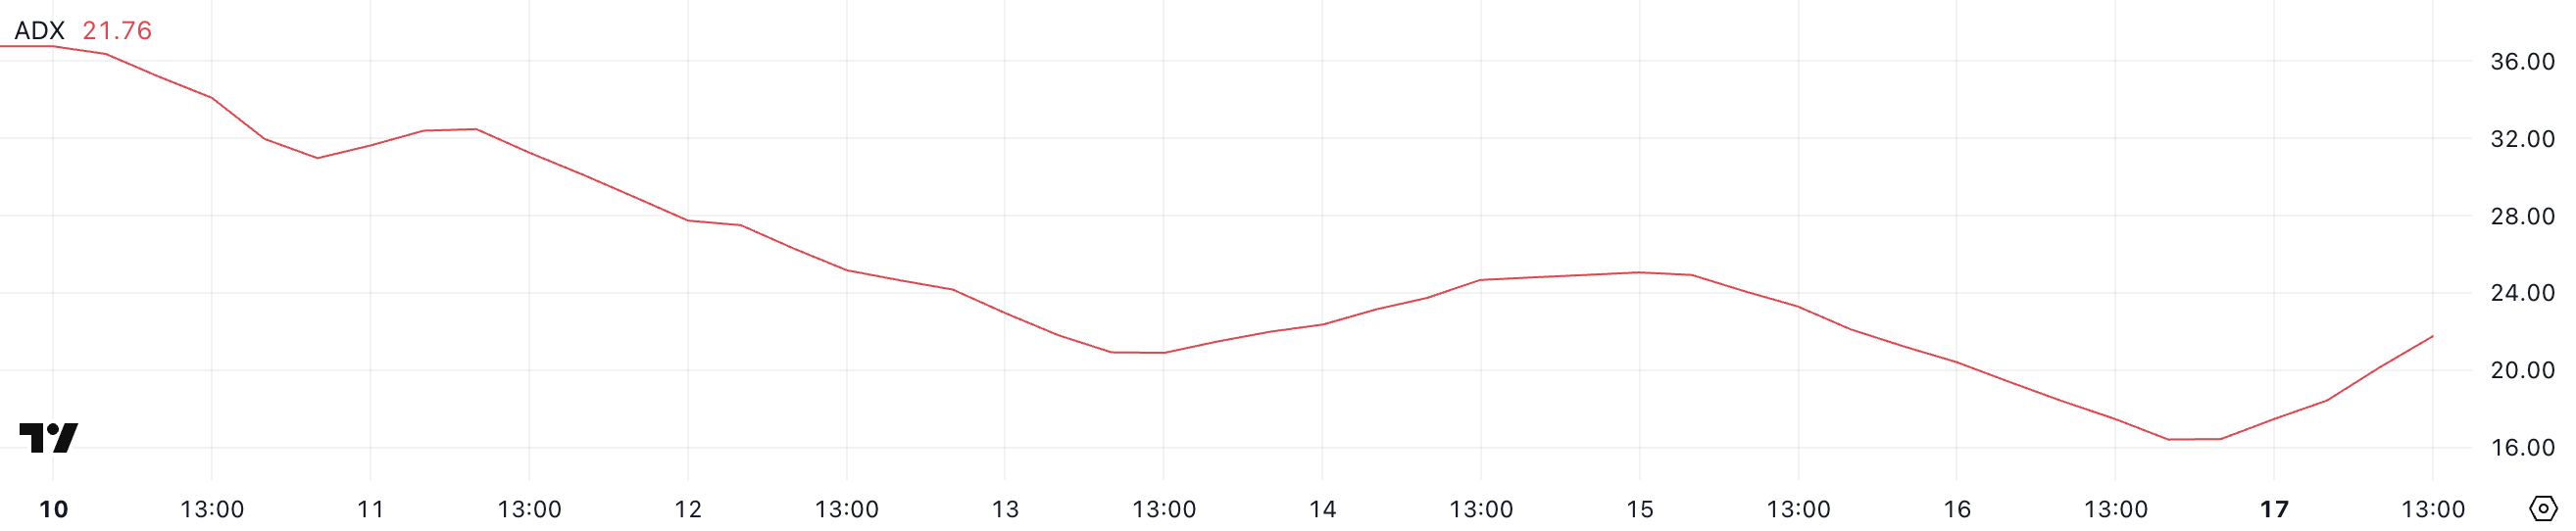
ADA ADX.ADA ADX. Source: TradingView.

This increase in ADX indicates that ADA is attempting to shift from a downtrend to an uptrend. While the trend reversal isn’t confirmed yet, a continued rise in ADX above 25 would signal stronger bullish momentum.

If buying pressure increases, ADA price could establish an uptrend, but if momentum weakens, it may struggle to sustain its recovery.

Cardano Whales Are Not Convinced Yet

The number of Cardano whales – addresses holding between 1 million and 10 million ADA – currently stands at 2,466 and has remained relatively stable in recent weeks.

Tracking these large holders is important because whales can influence price movements through significant buy or sell actions. A rise in whale activity often signals accumulation or distribution phases, impacting market sentiment and liquidity.
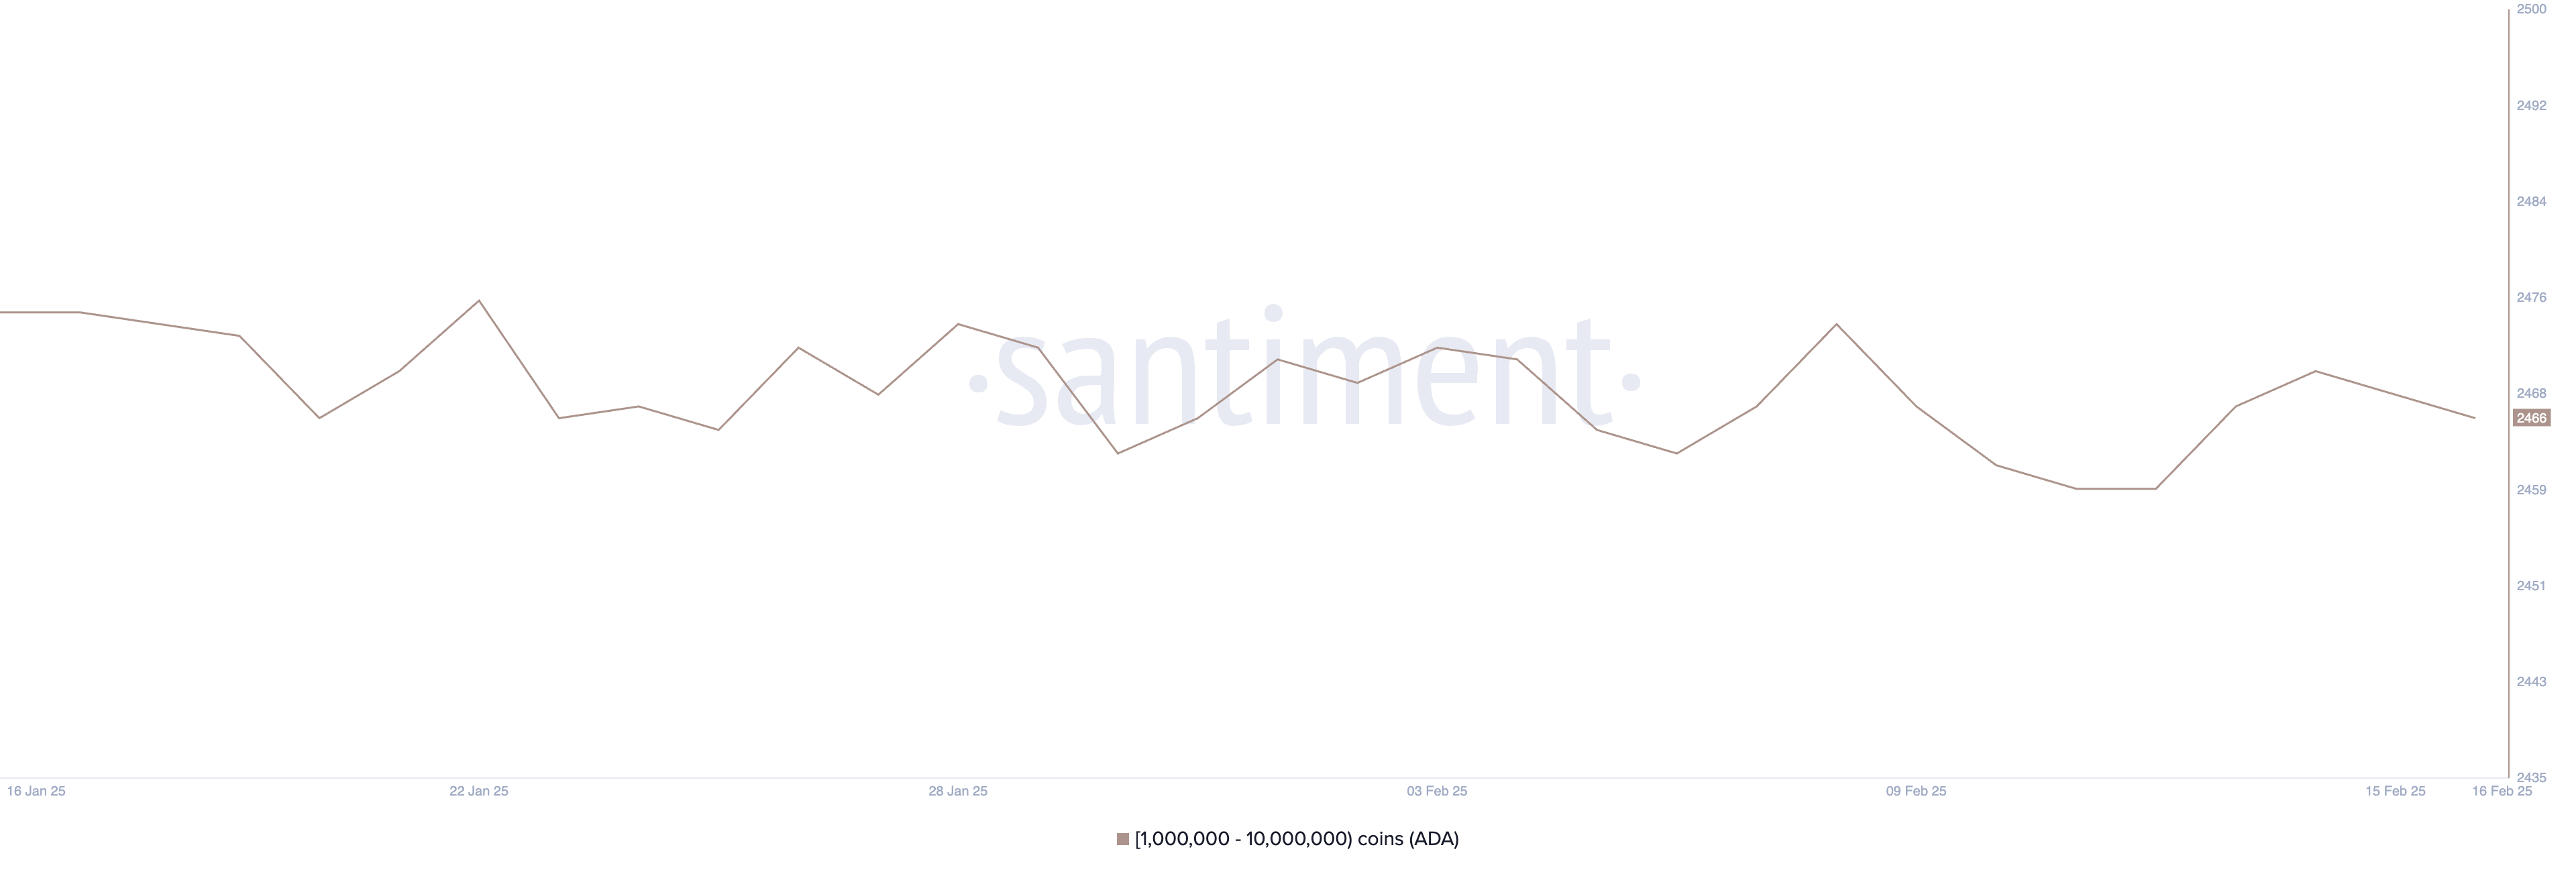
Addresses Holding Between 1 Million and 10 Million ADA.Addresses Holding Between 1 Million and 10 Million ADA. Source: Santiment.

The stability in the number of ADA whales suggests that large holders are neither aggressively buying nor selling. This could mean that ADA is in a consolidation phase, where price movement remains steady until new catalysts emerge.

If whales start accumulating, it could signal confidence in a potential uptrend, while a decline in whale holdings might indicate increased selling pressure.

ADA Price Prediction: Will ADA Reclaim Levels Above $1 In February?

ADA’s EMA lines show short-term moving averages trending upward, signaling potential bullish momentum. If a golden cross forms, Cardano price could continue rising to test resistance at $0.90.

A breakout above this level could push it to $0.98, and if momentum strengthens, ADA price could reach $1.16, trading above $1 for the first time since mid-January.
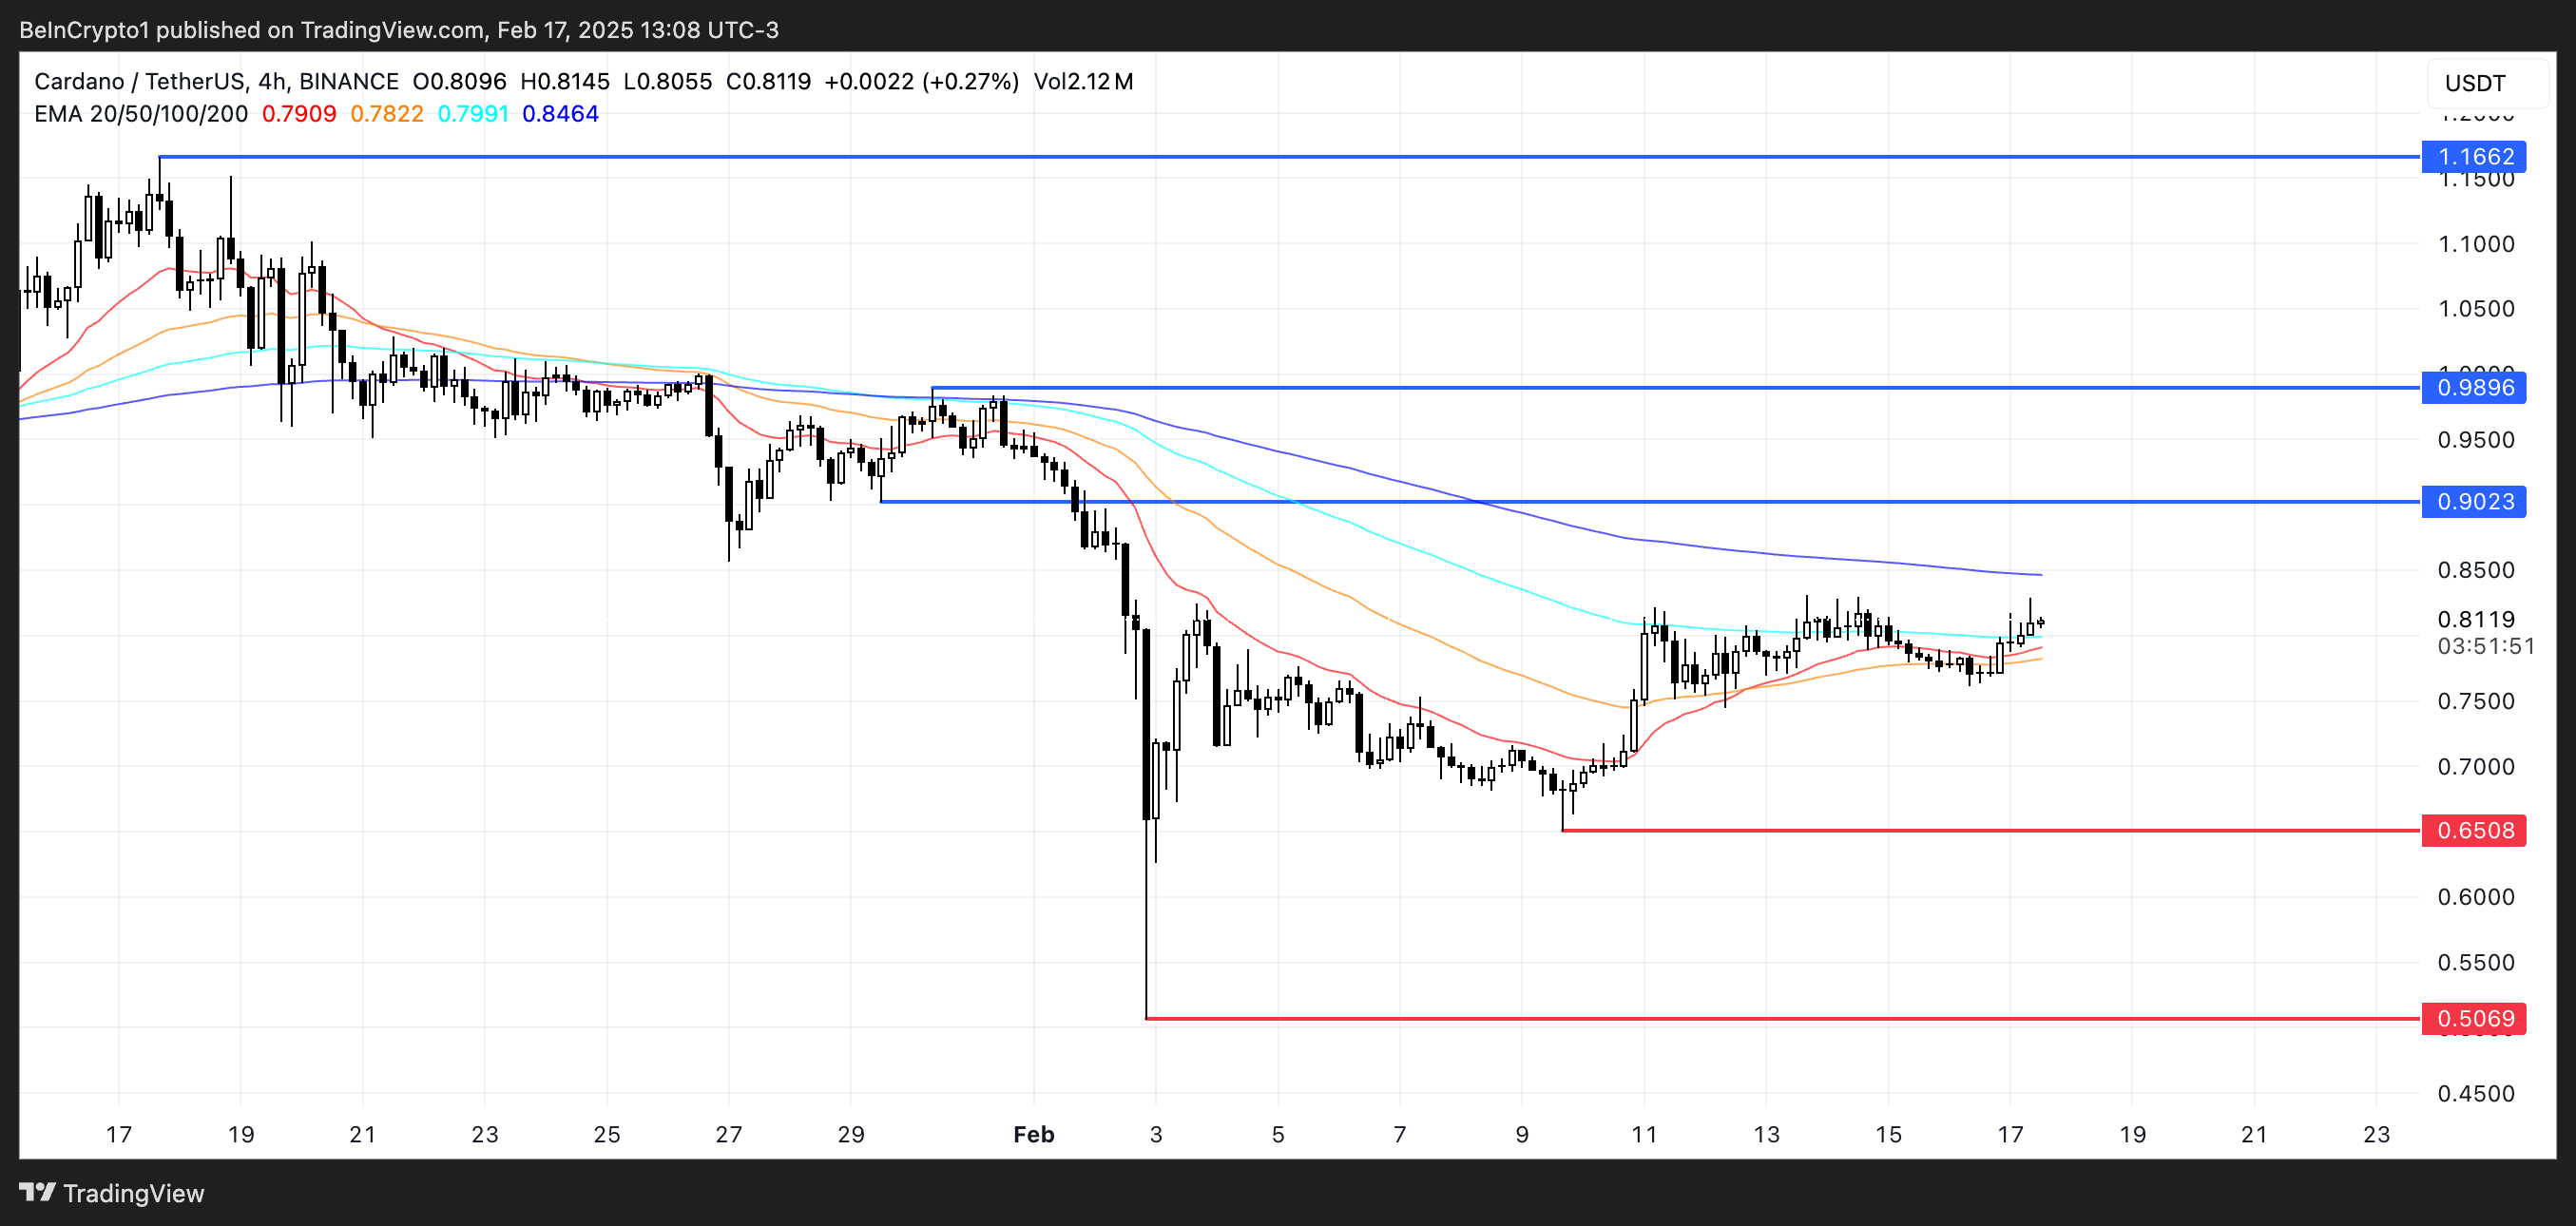
ADA Price Analysis.ADA Price Analysis. Source: TradingView.

On the downside, if the uptrend fails to gain strength, ADA price could retest support at $0.65.

Losing this level might trigger a deeper decline to $0.50, marking a potential 37% correction.

Disclaimer: For information purposes only. Past performance is not indicative of future results.
placeholder
Financial Markets 2026: Volatility Catalysts in Gold, Silver, Oil, and Blue-Chip Stocks—A CFD Trader's OutlookGet a comprehensive financial market 2026 outlook exploring key economic drivers, volatility catalysts in gold, oil and stocks, and what the evolving economic outlook means for cfd trading strategies and risk management on global markets.
Author  Rachel Weiss
May 15, Fri
Get a comprehensive financial market 2026 outlook exploring key economic drivers, volatility catalysts in gold, oil and stocks, and what the evolving economic outlook means for cfd trading strategies and risk management on global markets.
placeholder
Japanese Yen rallies to February 18 high as upbeat wage data and GDP lift BoJ hike betsThe USD/JPY pair declines for the second straight day – also marking the fourth day of a fall in the previous five – and sinks to its lowest level since February 18, around mid-153.00s during the Asian session on Tuesday.
Author  FXStreet
Sep 08, Tue
The USD/JPY pair declines for the second straight day – also marking the fourth day of a fall in the previous five – and sinks to its lowest level since February 18, around mid-153.00s during the Asian session on Tuesday.
placeholder
Gold slumps to near $4,350 amid oil-driven inflation fears, US inflation data in focusGold price (XAU/USD) falls to near $4,350 during the early Asian session on Wednesday. The precious metal faces some selling pressure as rising oil prices fueled inflation ‌concerns and boosted expectations for a rate hike by the Federal Reserve (Fed) in September.
Author  FXStreet
Sep 09, Wed
Gold price (XAU/USD) falls to near $4,350 during the early Asian session on Wednesday. The precious metal faces some selling pressure as rising oil prices fueled inflation ‌concerns and boosted expectations for a rate hike by the Federal Reserve (Fed) in September.
placeholder
Brent holds above $100 as tanker attacks tighten supply — but four forces are capping the rallyBrent crude is holding above $100 a barrel for a second session, its first close above the level since late July, as tanker attacks near the Strait of Hormuz squeeze an already tight physical market. Yet the rally has been gradual: 8.3 mb/d of Gulf output is still shut in, diesel is at a record, and forecasts now range from $74 to $100.
Author  Irene Q.
Yesterday 07: 34
Brent crude is holding above $100 a barrel for a second session, its first close above the level since late July, as tanker attacks near the Strait of Hormuz squeeze an already tight physical market. Yet the rally has been gradual: 8.3 mb/d of Gulf output is still shut in, diesel is at a record, and forecasts now range from $74 to $100.
placeholder
US August CPI lands tonight: after a 5.4% PPI shock, will the Fed hike on September 16?US August PPI came in at 5.4% year-on-year, above the 5.3% consensus, with core PPI at 4.6%. Traders have pushed the odds of a 25bp Fed hike on September 15-16 to around 70%. Tonight's CPI is the last major inflation print before the decision — here is the full calendar, the consensus numbers, and what a hot versus cool reading would mean for the dollar, yields, gold and stocks.
Author  Irene Q.
7 hours ago
US August PPI came in at 5.4% year-on-year, above the 5.3% consensus, with core PPI at 4.6%. Traders have pushed the odds of a 25bp Fed hike on September 15-16 to around 70%. Tonight's CPI is the last major inflation print before the decision — here is the full calendar, the consensus numbers, and what a hot versus cool reading would mean for the dollar, yields, gold and stocks.
goTop
quote