BNB Price Forecast: Shows signs of weakness as development activity reaches its lowest level in four months

Source Fxstreet
  • BNB’s price faces rejection from its previously broken ascending trendline, hinting at a downturn ahead.
  • The technical outlook suggests a bearish move as its momentum indicators show weakness.
  • Santiment’s data shows that BNB’s development activity reached its lowest level in four months, reflecting waning confidence in its blockchain projects.

BNB (BNB) faces rejection from its previously broken ascending trendline around $686 on Wednesday, hinting at a downturn ahead. The technical outlook suggests a bearish move as its momentum indicators show weakness. Moreover, Santiment’s data shows that BNB’s development activity reached its lowest level in four months, reflecting waning confidence in its blockchain projects.

BNB price faces resistance around the previously broken ascending trendline

BNB’s price broke below its ascending trendline (drawn by connecting multiple lows since early August 2024) on Sunday and declined 2.7% that day. However, it has risen and faced rejection around its broken trendline multiple times since Monday. At the time of writing on Wednesday, it again faces resistance around the trendline level of around $686.17, which coincides with the 50-day Exponential Moving Average.

If the previously broken trendline holds as resistance, BNB’s price could extend the decline to retest its daily support at $612.50.

The Relative Strength Index (RSI) on the daily chart reads 43, below its neutral level of 50 and points downwards, indicating increasing bearish momentum. The Moving Average Convergence Divergence (MACD) indicator also shows a bearish crossover, suggesting a sell signal and a downtrend. 
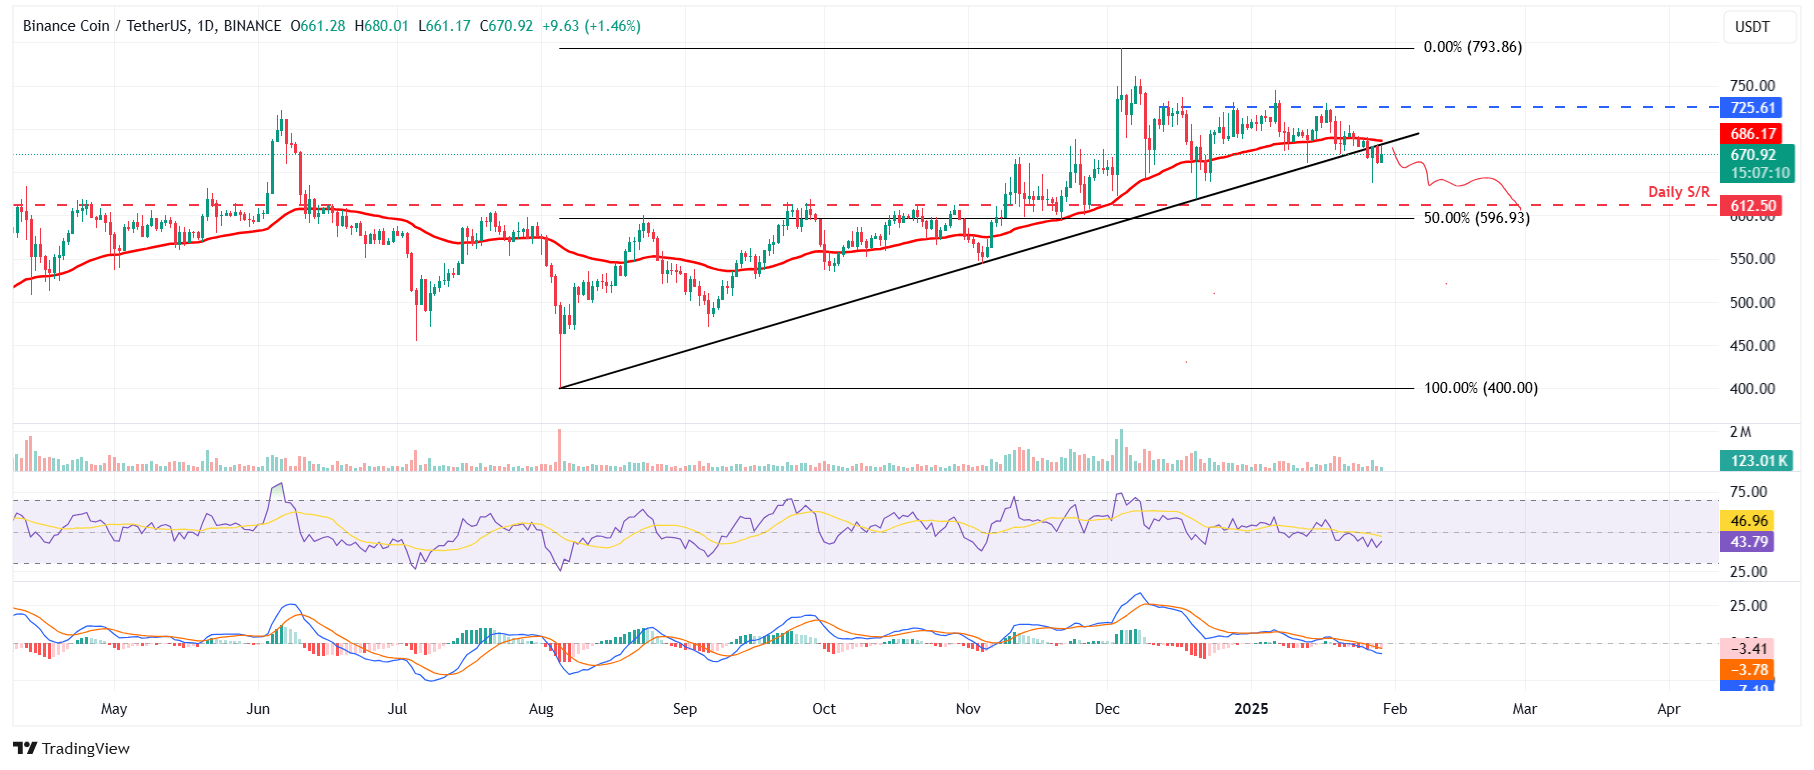
BNB/USDT daily chart 

BNB/USDT daily chart 

Moreover, Santiment’s Development Activity Index shows project development activity over time based on several pure development-related events in the project’s public GitHub repository.

In BNB’s case, the index sharply fell from 40.43 on January 19 to 20.5 on Wednesday. This trend has been falling since early January and reflects waning confidence in its blockchain projects, which, in turn, undermines investor trust and reinforces the negative market sentiment.

BNB Development Activity chart. Source: Santiment

BNB Development Activity chart. Source: Santiment

Disclaimer: For information purposes only. Past performance is not indicative of future results.
placeholder
AUD/USD: Current price action is likely the early stages of a recovery – UOB GroupAustralian Dollar (AUD) is likely to trade in a sideways range between 0.6220 and 0.6290. In the longer run, current price action is likely the early stages of a recovery phase that could potentially reach 0.6350, UOB Group’s FX analysts Quek Ser Leang and Lee Sue Ann note.
Author  FXStreet
Jan 22, Wed
Australian Dollar (AUD) is likely to trade in a sideways range between 0.6220 and 0.6290. In the longer run, current price action is likely the early stages of a recovery phase that could potentially reach 0.6350, UOB Group’s FX analysts Quek Ser Leang and Lee Sue Ann note.
placeholder
Five bullish Shiba Inu (SHIB) Price Predictions for April 2025SHIB price targets diverge as investors weigh Shibarium L3 upgrades, burn-rate surges, and altcoin market sentiment. Forecasts range from a conservative $0.000012 to a parabolic $0.00030.
Author  FXStreet
Apr 16, Wed
SHIB price targets diverge as investors weigh Shibarium L3 upgrades, burn-rate surges, and altcoin market sentiment. Forecasts range from a conservative $0.000012 to a parabolic $0.00030.
placeholder
Ethereum Price Stays Resilient — Upside Break May Be AheadEthereum price started a downside correction below the $1,780 level. ETH is now consolidating near the $1,800 zone and might aim for a move above $1,820.
Author  NewsBTC
Yesterday 03: 52
Ethereum price started a downside correction below the $1,780 level. ETH is now consolidating near the $1,800 zone and might aim for a move above $1,820.
placeholder
Gold price slides back closer to $3,300 amid tariff deals optimismGold price (XAU/USD) struggles to capitalize on the previous day's bounce from the vicinity of the $3,265-3,260 pivotal support and attracts fresh sellers during the Asian session on Tuesday.
Author  FXStreet
21 hours ago
Gold price (XAU/USD) struggles to capitalize on the previous day's bounce from the vicinity of the $3,265-3,260 pivotal support and attracts fresh sellers during the Asian session on Tuesday.
placeholder
EUR/USD ticks lower despite uncertainty over US-China tradeEUR/USD edges lower to near 1.1400 during European trading hours on Tuesday. The major currency pair ticks lower as the US Dollar (USD) steadies, but remains broadly on edge amid escalating uncertainty about the trade outlook between the United States (US) and China.
Author  FXStreet
18 hours ago
EUR/USD edges lower to near 1.1400 during European trading hours on Tuesday. The major currency pair ticks lower as the US Dollar (USD) steadies, but remains broadly on edge amid escalating uncertainty about the trade outlook between the United States (US) and China.
Related Instrument
goTop
quote